Market Recap for Tuesday, December 15, 2015
Energy and financials were the leaders in Tuesday's rally as all nine sectors gained ground, supporting the market's two day rally. Given the significance of today's Fed decision which will likely produce the first interest rate hike in the U.S. in nine years, it was comforting to see financials rallying. Banks, investment, and insurance companies were solidly higher. It had been particularly brutal for many of these groups during the first half of December as the 10 year treasury yield ($TNX) was under pressure throughout much of this period as well. But with prospects of a rate hike at hand, traders flocked into the groups that should benefit from a rise in treasury yields. Here's an updated view of the life insurance space where a trendline break and negative divergence had thwarted its earlier rally attempt:
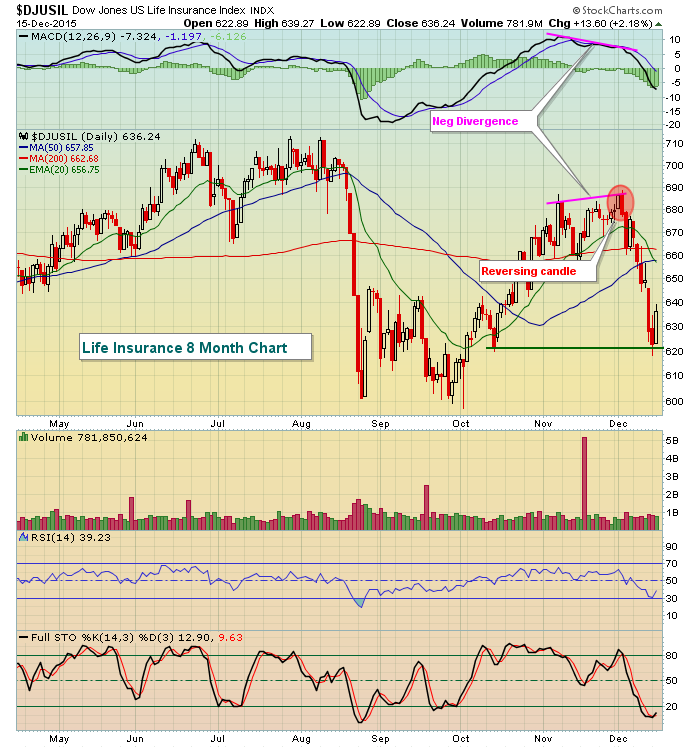
620 appears to be the price support level where buyers felt the reward to risk justified a return on the long side. Tuesday was very solid action. At first glance at this daily chart, you might think this pattern is bearish as the October and November rally fell well short of the earlier 2015 highs. However, it's always a good idea to step back and look at a longer-term chart to determine an overall strategy for an index, sector, industry group or stock. Take a look at this weekly chart as I believe it paints a much more bullish picture:
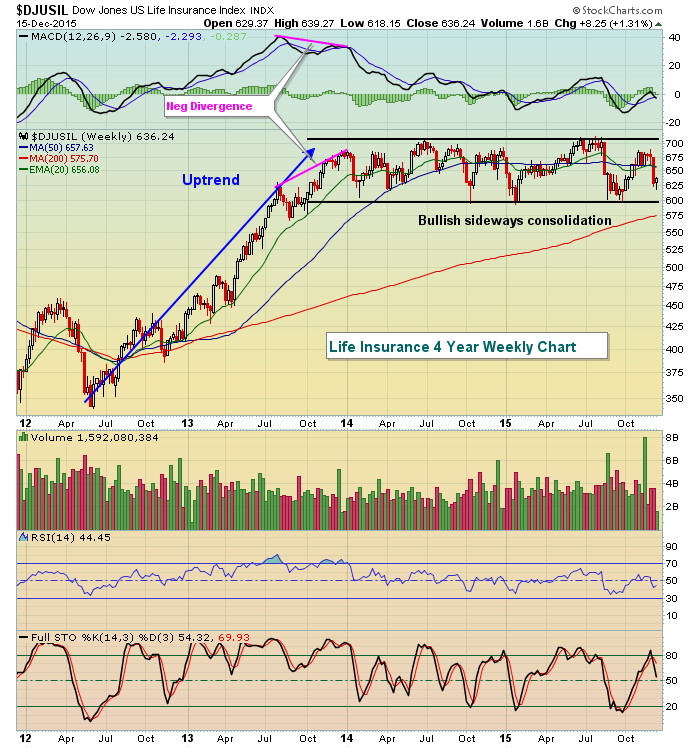
Life insurance companies rallied strongly until late 2013 when a negative divergence indicated that momentum was slowing and consolidation was needed. Since that time, the DJUSIL has sideways consolidated, or based, for the past two years and a breakout ultimately would be extremely bullish and resume the prior uptrend. Clearly, this longer-term view emphasizes that the daily chart is simply a small piece of a much larger bullish puzzle. It's always a good idea to review long-term patterns before making decisions about a shorter-term chart.
Pre-Market Action
Housing starts and building permits both were reported 30 minutes ago ahead of expectations and that solid economic news has added to already bright green U.S. futures this morning. We've moved past the December 7 to December 15 bearish historical period and action across the globe is quite positive. Asian markets were solidly higher overnight and that's being followed by more buying in Europe. We should get off to a very good start and then we'll go from there as the Fed prepares to release its interest rate decision at 2pm EST today. Action tends to be extremely volatile immediately after the release so I'll be looking to see if any major support or resistance levels are cleared with its release. Key support, in my view, are the intraday lows established last Friday.
Current Outlook
Well, it's finally here. Fed Day. At 2pm EST this afternoon, the Federal Reserve will likely end the period of falling interest rates as the fed funds target rate is expected to be increased to 0.375% from a range of zero to 0.25%. How will traders react? That's anybody's guess, but my expectation is that the U.S. stock market will breathe a sigh of relief and rally based on historical tendencies. It's one less uncertainty that the market will have to deal with in the near-term and that's likely to be viewed positively. I'll be watching to see how the treasury market reacts as well. I'm looking for selling of treasuries with an ultimate test on the 10 year treasury yield at 2.50%, matching highs in early November and early December.
The most intriguing part of any ensuing rally will be which sectors benefit the most. Should the S&P 500 rally - as I expect - will the more aggressive groups lead? Lately, we've seen deterioration in both the XLY:XLP and $TRAN:$UTIL ratios, indicative of money flowing towards defensive areas of the market. THIS NEEDS TO CHANGE on any rally attempt or I'll grow much more bearish the prospects of the U.S. equity market. Here's the visual to further describe my fears:
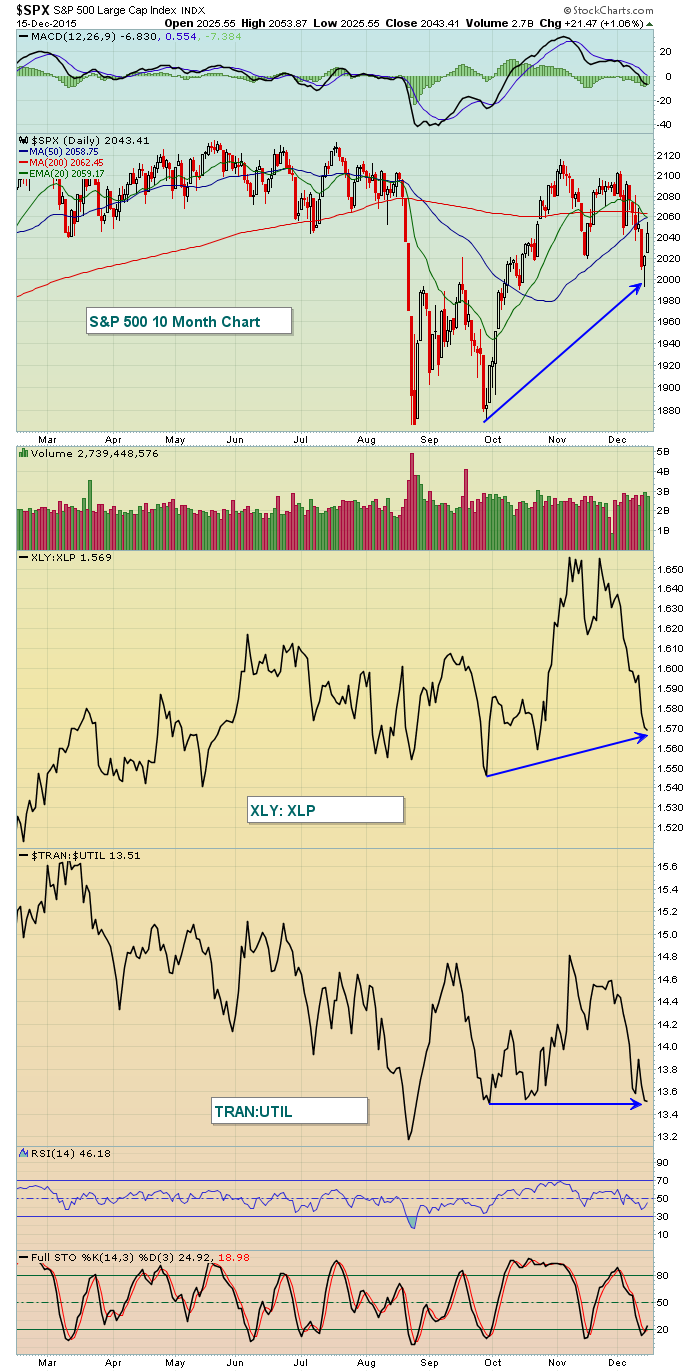
While the S&P 500 is well above its September lows, the relative ratios of the XLY:XLP and TRAN:UTIL have barely budged to the upside and that suggests traders are not overly aggressive during this overall rise in the benchmark index. If the S&P 500 continues to rally and these relative ratios continue to fall, it will be perhaps the biggest bearish signal sent by traders since this bull market started in 2009. Conversely, a rally in the S&P 500 that is accompanied by renewed strength in these ratios would suggest the rally is sustainable and I'd look for further bull market gains in the months ahead.
Sector/Industry Watch
Microsoft (MSFT) reported very strong earnings in its last quarter and that enabled software stocks ($DJUSSW) to become relative leaders. Since the MSFT earnings, the DJUSSW has languished in sideways fashion for the past 6-8 weeks, but it hasn't lost its bullish formation. Its latest weakness took price action down to gap and price support just below the 1200 level. The bounce was to be expected and I'd further expect to see this industry group challenge its recent highs over the next few weeks, which are bullish for technology historically. Check this out:
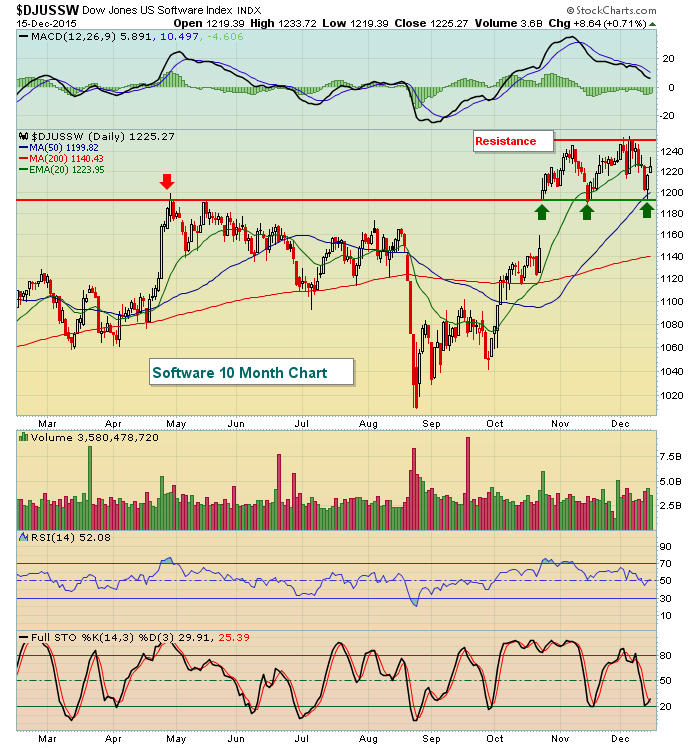
The uptrend off the August low has been followed by bullish consolidation (flag). These patterns generally are followed by a breakout to resume the prior trend, which is exactly what I'd look for in this case - at least until proven otherwise.
Historical Tendencies
In addition to much higher annualized returns in the second half of December on our major indices, here's another interesting fact. Since 1950 on the S&P 500, the December 16 to December 31 period has produced 393 up days and 275 down days. This represents a 58.83% chance of the S&P 500 moving higher on a given day during this period. That compares to just 53.32% chance throughout the calendar year. The December 21 to December 31 period is the strongest within this bullish historical period as the chance of an up day during this shortened period rises to 62.19% over the past 65 years.
Key Earnings Reports
(actual vs. estimate):
JOY: .43 vs .42
(reports today after close, estimate provided):
FDX: 2.53
JBL: .70
ORCL: .57
WOR: .55
Key Economic Reports
November housing starts released at 8:30am EST: 1,173,000 (actual) vs. 1,141,000 (estimate)
November building permits released at 8:30am EST: 1,289,000 (actual) vs. 1,146,000 (estimate)
November industrial production to be released at 9:15am EST: -0.2% (estimate)
November capacity utilization to be released at 9:15am EST: 77.4% (estimate)
December PMI manufacturing to be released at 9:45am EST: 52.8 (estimate)
Happy trading!
Tom
