Market Recap for Monday, December 14, 2015
Eight of the nine sectors finished higher on Monday as the U.S. stock market made a case for a near-term bottom. We know the middle of December tends to turn in favor of the bulls and there were plenty of kick saves across the board to suggest the near-term just got a lot brighter. Let's start with the NASDAQ where the afternoon reversal resulted in a very bullish hammer printing on key short-term support. Have a look:
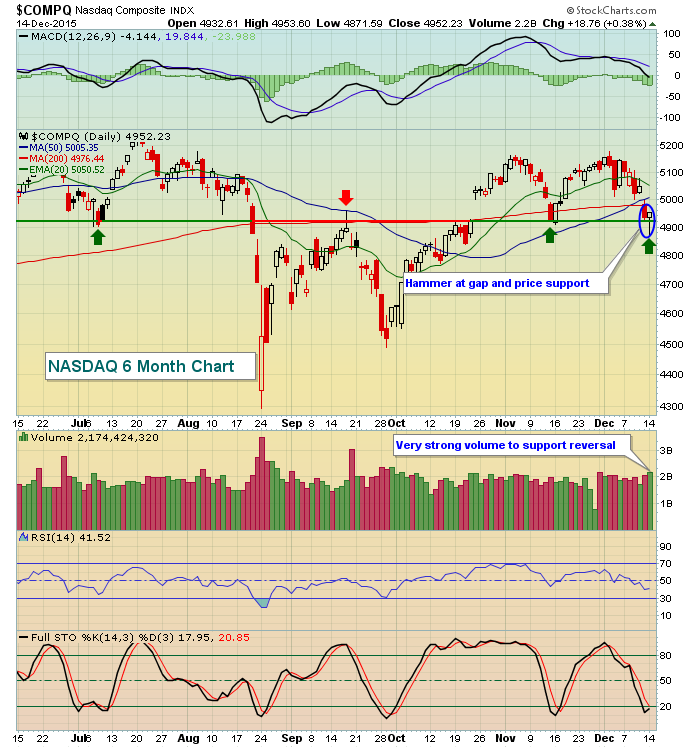
Volume increased to 2.2 billion shares and that's important for the bullish argument as it reflects likely market maker participation in the rally. There wasn't strength everywhere, however, as materials (XLB) finished the session 1.32% lower as nonferrous metals ($DJUSNF) and gold mining ($DJUSPM) shares were rocked. The latter is just a few days removed from attempting to clear short-term price resistance. That's now a distant memory as the prior downtrend appears ready to resume:
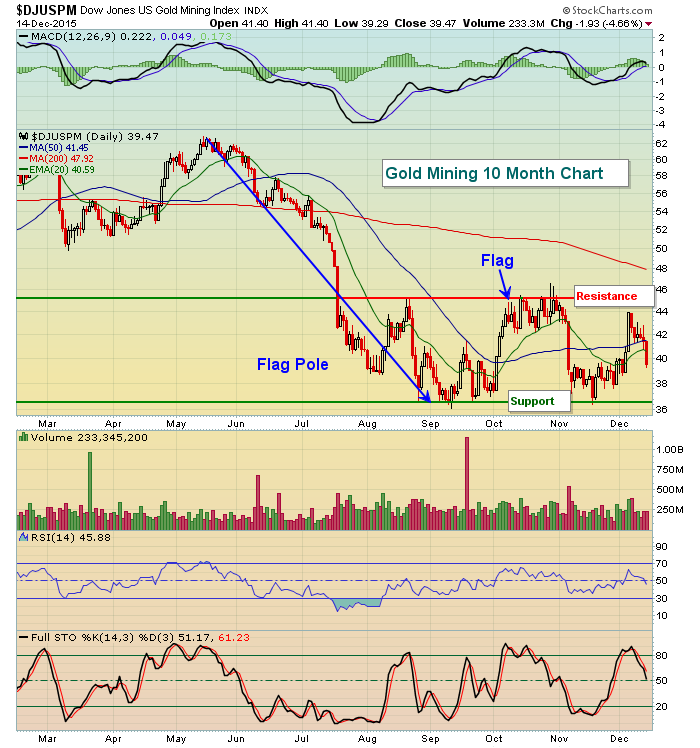
The price of gold and gold mining shares remain among the most technically-challenged areas of the market and I'd continue to steer clear for the foreseeable future. I've said this is one area I'd consider shorting and given the bearish flag pattern above, nothing has changed. Avoid gold and gold-related shares.
Pre-Market Action
Asian markets finished lower overnight, but solid bullish behavior in Europe this morning after a brutal first half of December has U.S. futures jumping higher on the heels of Monday's reversal. Should the strength in futures hold into today's open, the low on Monday becomes a very important short-term support level for the bulls. Those lows become identifiable intraday stops if you trade this potential second half of December rebound on the long side.
The German DAX shows lower highs and lower lows over each of the past five trading days and while this morning's strength is good news, we have yet to break that string of losses. There also remains overhead price resistance near 10500. Clearing that level would give the bulls here in the U.S. a much more positive feeling about stock market direction. One step at a time here.
The home construction ($DJUSHB) group will be watched closely today for a couple reasons. First, there's a housing market report due out at 10am EST and of course the Federal Reserve begins a two day meeting to discuss whether to raise interest rates in the U.S. for the first time since 2006. Technically, the DJUSHB is very bullish in my view though the December action has been very difficult. I look for that to change and consider the last several months of sideways action to be a basing pattern that will precede the next breakout. 500 is an important support level as reflected on the chart provided below under the Sector/Industry Watch section of today's article.
Current Outlook
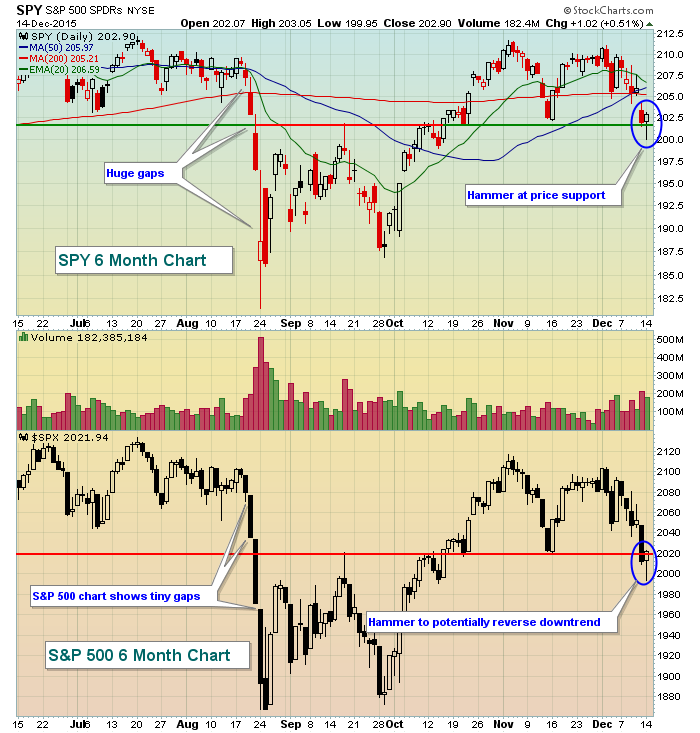
Periods of market consolidation do nothing to longer-term investors. It's all just noise as you patiently await the next breakout in a near 7 year bull market. For traders, however, consolidation can mean very frustrating back and forth action where the market's intentions seem to change every other day. While nothing provides us a guarantee, the odds of a short-term advance just improved with Monday's reversal. It wasn't just a reversal on the NASDAQ. The benchmark S&P 500 also printed a solid reversing hammer on Monday as the bears failed to take advantage of an intraday price breakdown. Any time you're looking at candlesticks, use the SPY (ETF that tracks the S&P 500) chart instead of the S&P 500 ($SPX) chart itself. Why? Because many stocks on the S&P 500 do not open for trading exactly at 9:30am EST. Many open a few seconds later and as a result, the "opening" price for those stocks at 9:30am EST remains unchanged from the prior day. Therefore many large gaps at the open on the SPY are not properly reflected on the SPX. On the chart below, note the hammer that printed, but also note the highlighted gaps on the SPY that mysteriously do not appear on the SPX:
Monday's candle shows that long tail, or shadow/wick, which reflects the intraday low. That low was accompanied by a VIX that topped at 26.81. This reflects serious nervousness in the market and bears had a massive opportunity to drive prices much, much lower. Simply put, they failed. The VIX closed at 22.73, which remains elevated but a reversing dark cloud cover candle printed at a resistance level. Therefore, the odds are that the VIX has topped near-term. Here's the updated chart of the VIX:
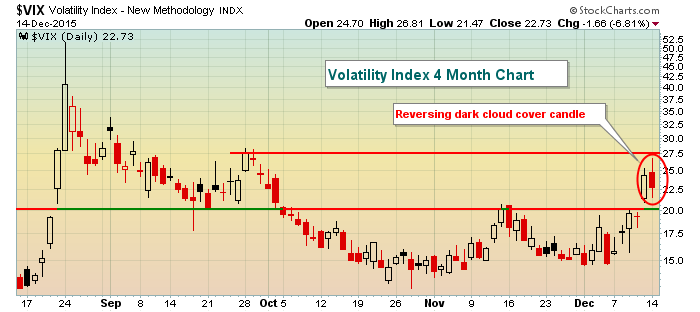
That reversal indicates the current trading range on the VIX is between 20.00-27.50. If the bears hope to further capitalize on the recent downtrend, it will be important for the VIX to remain above 20.00. A drop below is confirmation of the reversal in our major indices.
Sector/Industry Watch
As mentioned above, home construction ($DJUSHB) will be under close scrutiny by traders as it consolidates within a very bullish longer-term pattern. Check it out:
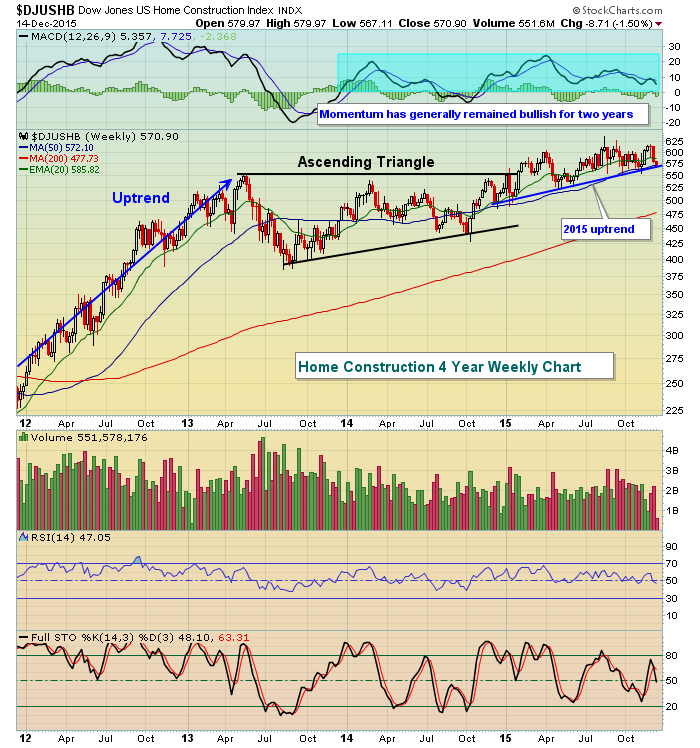
Recent weakness has left the DJUSHB sitting on trendline support. More importantly, there's a long-term ascending triangle pattern that upon breakout at 550 measured to 715 in time. We appear to have much more room available to the upside in this pattern. Trendline support and price support close to 550 are the two most significant support levels for housing.
Historical Tendencies
The Russell 2000 is the strongest of our major indices during the month of December. Its relative strength resumes historically as of today's close. Below are today's negative annualized return since 1988 followed by the historical bullishness that we generally see:
December 15 (today): -105.68%
December 16 (Wednesday): +172.51%
December 17 (Thursday): +62.48%
December 18 (Friday): +53.45%
Key Earnings Reports
(actual vs. estimate):
FDS: 1.44 vs 1.46
Key Economic Reports
November CPI released at 8:30am EST: +0.0% (actual) vs. +0.0% (estimate)
November Core CPI released at 8:30am EST: +0.2% (actual) vs. +0.2% (estimate)
December empire state manufacturing survey released at 8:30am EST: -4.59 (actual) vs. -7.00 (estimate)
December housing market index to be released at 10:00am EST: 63 (estimate)
Happy trading!
Tom
