Market Recap for Wednesday, December 16, 2015
First, the good news. The Federal Reserve raised interest rates in the U.S. for the first time in nine years, signaling their belief that economic strength lies ahead with an improving labor market. The quarter point hike really will do little to thwart the meager economic growth we've seen to date, but it's more the psychological importance of the Fed standing behind their word of seeing enough strength in our economy to warrant the move. If you recall, Fed Chair Yellen and her band of Fed officials did everything but promise a rate hike in September and then failed to act. That failure to act resulted in more than a 7% haircut in the benchmark S&P 500 over the subsequent 11 days.
From a common sense perspective, it might seem that keeping interest rates lower for longer would be a positive thing for equities, but remember that the stock market always looks FORWARD. The inaction by the Fed sent negative vibes to market participants. There's an unwritten trust factor between the U.S. markets and the Federal Reserve and September's inaction violated it. Since Yellen's predecessor Bernanke served as Fed Chair, the Fed has indicated they've felt the need to be transparent so the market isn't shocked by the Fed's decisions. That backfired in September and created an uncertainty that previously did not exist. Yesterday's action to raise rates reversed that earlier mistake and equities rallied as a result. The rally wasn't exactly as the bulls had drawn it up, however. See the Current Outlook below for more detail.
Eight of the nine sectors rallied on the Fed's rate hike. Only energy (XLE) failed to finish higher on Wednesday, falling 0.66% as crude oil ($WTIC) fell 2.7% to 35.74 per barrel. Falling crude has kept pressure on the XLE, which remains in a trading range of 59.00-66.00 within an overall downtrend. Here's the current technical view of the XLE:
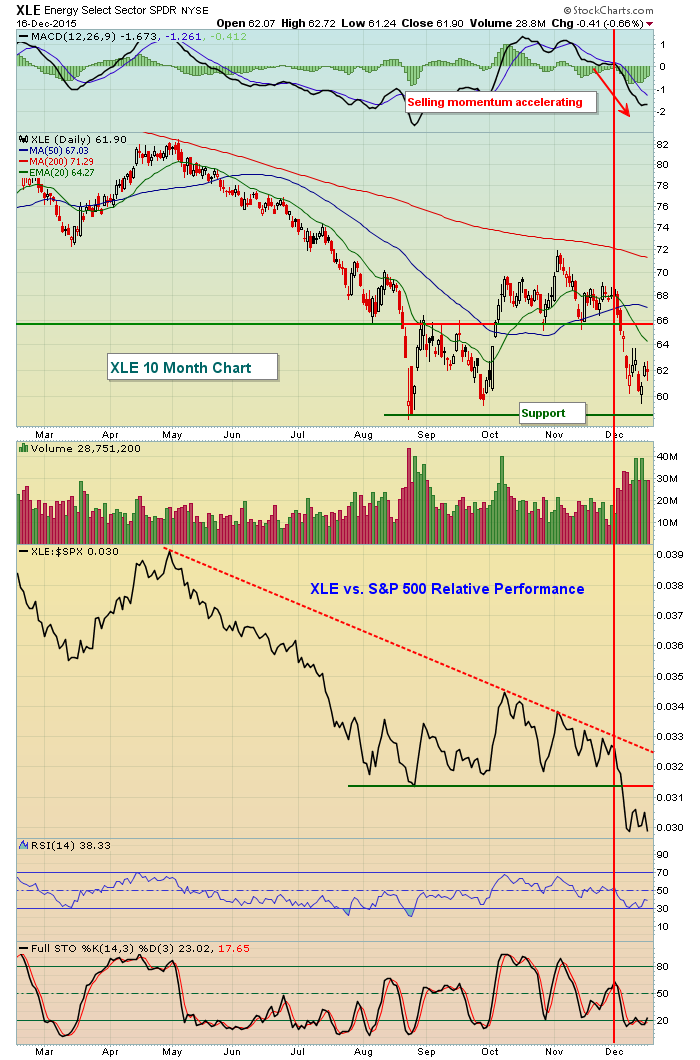
Not only was energy a non-participant in yesterday's Fed-induced rally, but you can also see its relative strength line (vs. benchmark S&P 500) recently broke to new lows and is mired in a long-term downtrend. Until that relative weakness changes, energy is an area to avoid from a short-term trading perspective. It most likely represents solid value for those who wish to hold for long periods of time, but that's not my style. Other than a potential short-term oversold bounce, the technical conditions here do not warrant a commitment of capital.
Of the eight sectors rising on Friday, utilities (XLU) and consumer staples (XLP) led the action. Unfortunately, both of these groups are defensive areas of the market. Furthermore, the strength in financials (XLF) was primarily the result of a very strong REIT group ($DJR) that rose nearly 2% on the session and is now bumping up against trendline resistance on its longer-term weekly chart. Have a look:
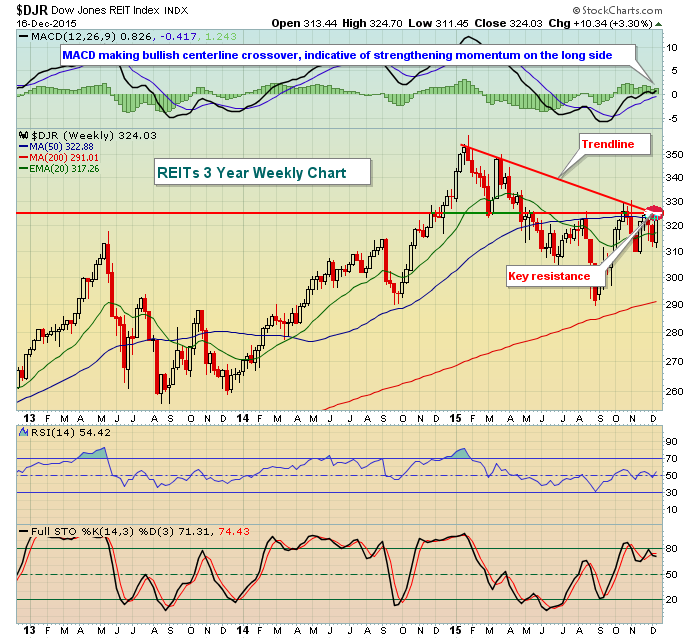
Let me say that during a bull market, I like to see ALL areas of the market participating. Therefore, I want to see the DJR make this breakout despite the fact that it's a defensive group. What I DO NOT want is the DJR leading on a relative basis to the upside, outperforming other areas of the financial space like banks ($DJUSBK) and life insurance ($DJUSIL).
Pre-Market Action
Interestingly, the 10 year treasury yield ($TNX) is down to 2.25% this morning after nearly reaching key resistance on Fed Day at the 2.35% level. The reversal in the TNX on Wednesday, along with today's early drop, follows suit with the market being somewhat defensive in terms of its gains after the FOMC policy decision was announced.
Overnight, Asian markets played "catch up" with the U.S. gains from Wednesday. European markets are solidly higher with the German DAX gains most notable because the DAX is easily clearing price resistance near the 10500 level. It's important to see the DAX regain technical strength as that index and the S&P 500 are highly correlated in positive fashion over time.
The Philadelphia Fed survey came in a bit weaker than expected, but has done little to slow traders, who are looking to extend Wednesday's gains. I'll be looking to see if money rotates more towards aggressive areas should the U.S. market once again tack on solid gains.
Current Outlook
To further illustrate my point about proper leadership during bull market rallies to new highs, take a look at what happened as we were breaking out of the 2011 correction:
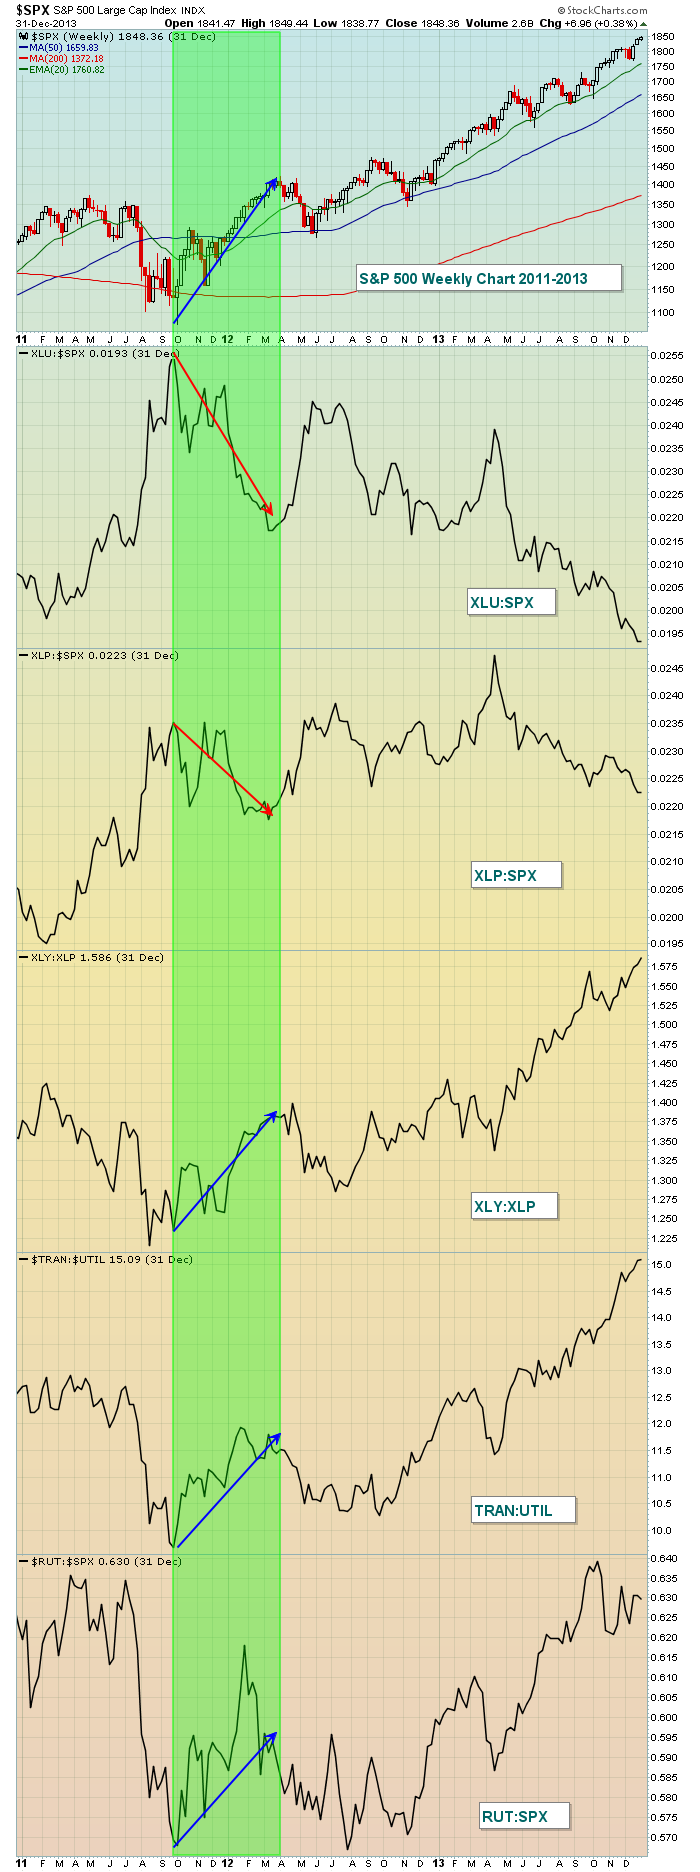
Note that during the breakout rally to fresh highs the defensive ratios fell while the aggressive ratios rallied? That tells us that traders are willing to take the risks necessary to sustain the bull market. The rest has been history. Now let's review where we are on this same chart right now:
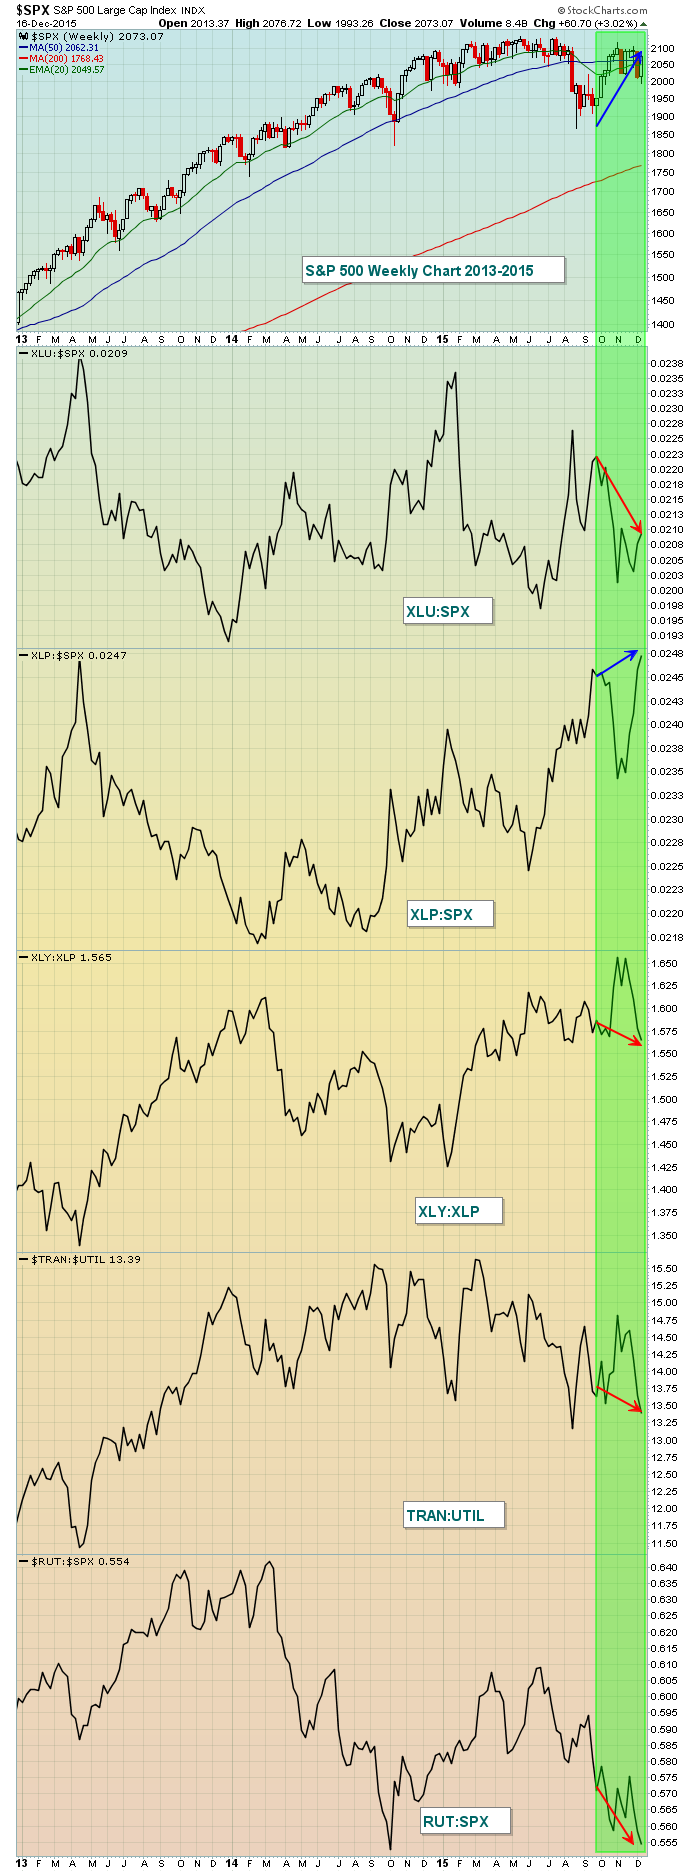
Do you see the difference? Keep in mind that the stock market can do anything it wants. We can analyze the markets every which way possible, but it doesn't guarantee us a thing. I use technical analysis to gauge risk, not to guarantee results. If the S&P 500 continues to rise and breaks out to all-time highs, I will be looking for the above ratios to support that move. Currently, 4 of the 5 do NOT support a sustainable advance. Only the XLU:SPX ratio confirms aggressive behavior by traders. The other ratios are suggesting that traders are growing more defensive and continuation of that mentality could signal the end of the bull market.
I DO remain bullish currently because price and volume patterns remain bullish in my opinion. But under the surface signals are changing and we need to be aware of that and continue to monitor it.
Sector/Industry Watch
Transportation stocks ($TRAN) have been under pressure over the past month and much of that weakness can be attributed to the selling in railroads ($DJUSRR). The Fed tells us that our economy is strengthening and likely to continue to do so, but the DJUSRR and the relative performance of small caps (Russell 2000 vs. S&P 500) tells us otherwise, which are confusing "under the surface" signals. Below depicts the lack of strength in transports vs. utilities ($TRAN:$UTIL) - even with yesterday's strong rally - and how this ratio is nearing a very significant relative support line:
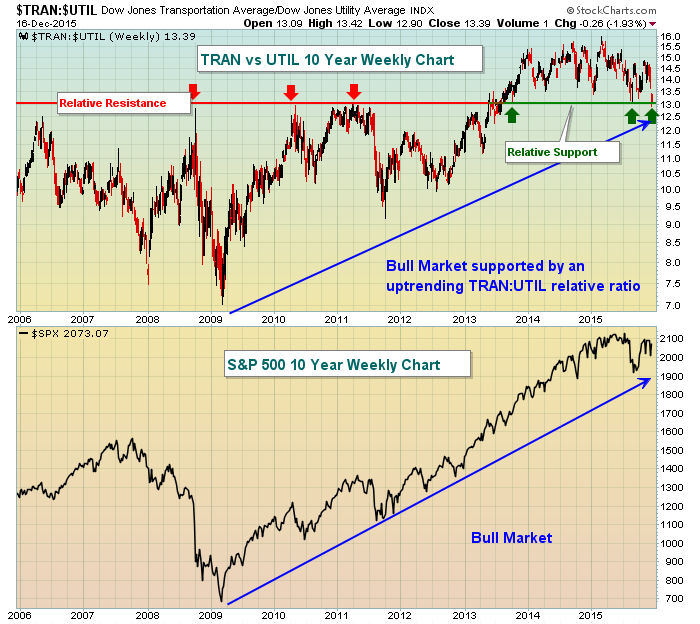
Violation of this relative support line near 13 would no doubt be a check mark in the bear's ledger and "bears" watching in coming days and weeks. The longer-term comparison of this ratio and how the S&P 500 performs I believe illustrates the importance of watching this ratio. While they don't mirror one another always, they do certainly have the tendency to rise and fall together. A "divergence" like we're seeing now is unusual and is one signal this rally may not be sustainable. I'll continue to watch this develop and update you as necessary.
Historical Tendencies
Yesterday (December 16) marked the beginning a very bullish historical period that runs through December 31 (and technically beyond to January 19). The across-the-board gains on Wednesday jump started this bullish historical period for sure.
Key Earnings Reports
(actual vs. estimate):
ACN: 1.28 vs 1.31
GIS: .82 vs .82
RAD: .06 vs .05
(reports after close today, estimate provided):
AAR: .30
RHT: .31
Key Economic Reports
Initial jobless claims released at 8:30am EST: 271,000 (actual) vs. 270,000 (estimate)
Philadelphia Fed manufacturing index released at 8:30am EST: -5.9 (actual) vs. +1.2 (estimate)
November leading indicators to be released at 10:00am EST: +0.2% (estimate)
Happy trading!
Tom
