Market Recap for Monday, December 21, 2015
Nothing in this market can seem to make up its mind. The Volatility Index ($VIX) is straddling a key 20 level, not allowing sentiment to move favorably in either the bulls or bears favor. The German DAX is straddling key short-term support/resistance at 10500. The S&P 500 continues to straddle its 1995 to 2020 support/resistance zone. The NASDAQ and NASDAQ 100 has now filled their respective gaps on multiple occasions - but without breaking down. The bulls claim victory one week, only to lose the next. This pattern has been playing out throughout 2015, but more recently the battle seems to take place on an intraday, hourly and daily basis as well. Frustrating? Yeah, on steroids.
I showed the daily chart of the S&P 500 yesterday with two horizontal lines marking the key support and resistance at 1995 and 2020 so I won't reprint that chart today. Instead, here's the hourly chart for the past few months, showing this frustrating area of indecision on a different time frame:
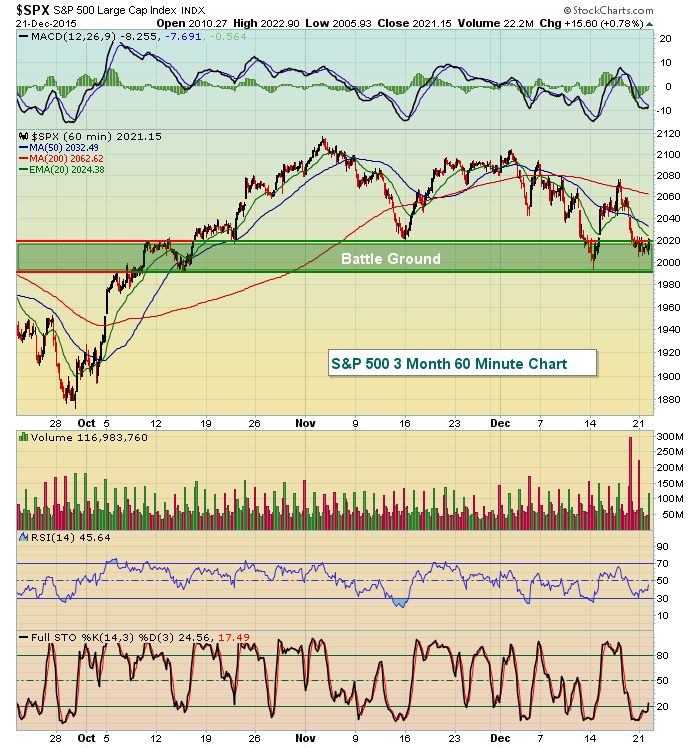
Not only has that 1995-2020 zone been key over the entire year, but you can also see it's played a big role technically in trading the past three months. Monday's action saw this "battle ground" tested once again. The close Monday? 2021. Victory for the bulls, right? ......................................<sigh>
We saw an end of day rally on Monday, which enabled eight of our nine sectors to finish in positive territory. But.......consumer staples (XLP) led the action and outperformed their consumer discretionary (XLY) counterparts - and by a wide margin. The rotation from the more aggressive XLY to the defensive XLP has been problematic since mid-November. So even on a decent market day, it's difficult to get overly excited.
Pre-Market Action
Asian markets were mixed overnight while European markets trade in similar fashion. The German DAX is currently just beneath a key 10500 level. It would provide U.S. equities a lift if the DAX could convincingly move back above that 10500 level.
This morning, the final estimate of Q3 GDP fell from 2.1% to 2.0% as expected. The FHFA housing market index and existing home sales will be released later this morning and that could impact the market, particularly home construction.
U.S. futures have been straddling the flat line, down earlier this morning but more recently moving just above the zero line.
Current Outlook
In my view, beneath the surface signals have been deteriorating in November and December. The chart below best sums it all up:
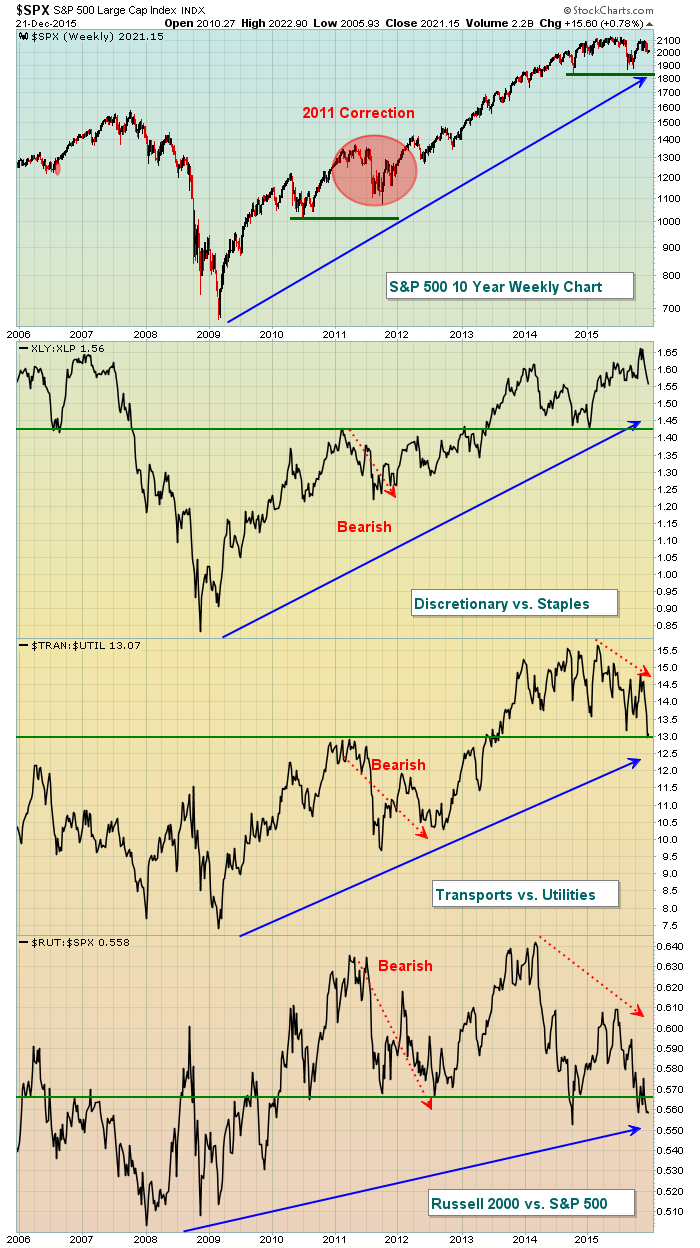
Money has been rotating away from aggressive areas of the market. That's what those red dotted directional lines over the past 1-2 years tells us. But the price pattern of higher highs and higher lows on the S&P 500 has not been broken. One thing I've learned over the years is that NOTHING trumps the combination of price/volume. That's my #1 indicator and #2 isn't close. Let's use history to illustrate my point. The 2011 correction painted a very similar picture. Money was rotating towards defensive areas as again that red dotted directional line illustrates. Relative trendlines and relative price support were broken on those supporting charts. But price action on the S&P 500 never succumbed and the bull market marched on. Making trading decisions off of secondary indicators alone would have resulted in a big, big mistake as history shows us. Have I grown more cautious because of the underlying action? You bet! But I remain bullish because of price action. Those green horizontal lines that mark price support are the most important signal, period. Price support was not violated in 2011 and it hasn't been violated in 2015. The bull market lives on. Again, there are signs that bear watching. But I'd be very careful about becoming overly bearish at this point. Cautiously bullish during a correction and outright bearish during a confirmed price breakdown and potential bear market are two completely different animals. If you are bearish, keep in mind the 2011 lesson. A closing breakout on the S&P 500 above 2131 should be your cue to admit mistake, cover your short and wait for another day to short. All of this is simply my opinion of course. You're entitled to yours.
Sector/Industry Watch
The 10 year treasury yield ($TNX) continues to consolidate in a symmetrical triangle. The directional break of this pattern is another piece of the stock market puzzle that we need to watch. A break to the upside signals rotation away from treasuries, which would be a bullish development for U.S. equities, while a downside move would produce the opposite effect. Here's the chart:
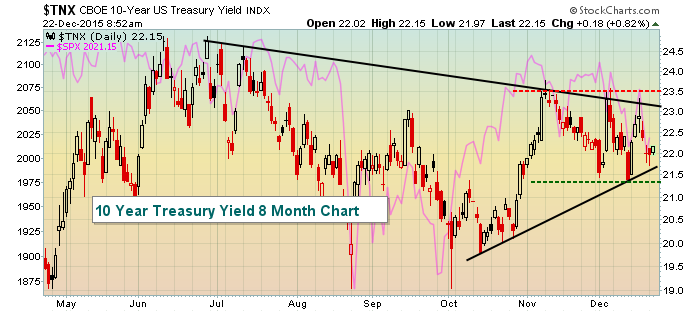
The pink line in the background represents S&P 500 performance. You can see that in the short-term, the TNX and SPX tend to move in the same direction. Therefore, an upside breakout in the TNX above triangle resistance (downtrending black line) and yield resistance near 2.35% should be viewed bullishly for equities. To the contrary, if the TNX breaks below triangle support (uptrending black line) and yield support near 2.13%, it would likely be bearish for equities.
Historical Tendencies
Yesterday, I provided historical annualized returns for the S&P 500 (since 1950) for each of the calendar days this week. Today, I'm providing the historical annualized returns on the NASDAQ (since 1971) for each of the calendar days through year end:
December 21 (yesterday): +120.80%
December 22 (today): +107.40%
December 23 (Wednesday): +65.96%
December 24 (Thursday): +27.83%
December 25 (Friday): Christmas Day - U.S. markets closed
December 28 (next Monday): -5.40%
December 29 (next Tuesday): +49.42%
December 30 (next Wednesday): +73.64%
December 31 (next Thursday): +109.92%
Key Earnings Reports
(actual vs. estimate):
CAG: .58 vs .59
PAYX: .52 vs .51
(reports after today's close, estimate provided):
MU: .23
NKE: .85
Key Economic Reports
Q3 GDP (final estimate) released at 8:30am EST: +2.0% (actual) vs. +2.0% (estimate)
October FHFA home price index to be released at 9:00am EST: +0.4% (estimate)
November existing home sales to be released at 10:00am EST: 5,320,000 (estimate)
Happy trading!
Tom
