Market Recap for Friday, December 18, 2015
Friday's action was marked by short-term price breakdowns in a few of our major indices, sectors and industry groups. It also was accompanied by extremely heavy "quad-witching" volume. Quad-witching refers to the 3rd Friday of March, June, September and December, which represents the expiration dates of various stock index futures, stock index options, stock options and single stock futures. Because both futures and options traders must close out positions on these days, volume typically sees a significant increase and that was most definitely the case on Friday. Some of this increased volume was associated with technically poor action as well though. We can't simply blame it on quad witching. For instance, the S&P 500 again failed to hold 2020 and lost the prior week's closing low of 2012. Here's the chart:
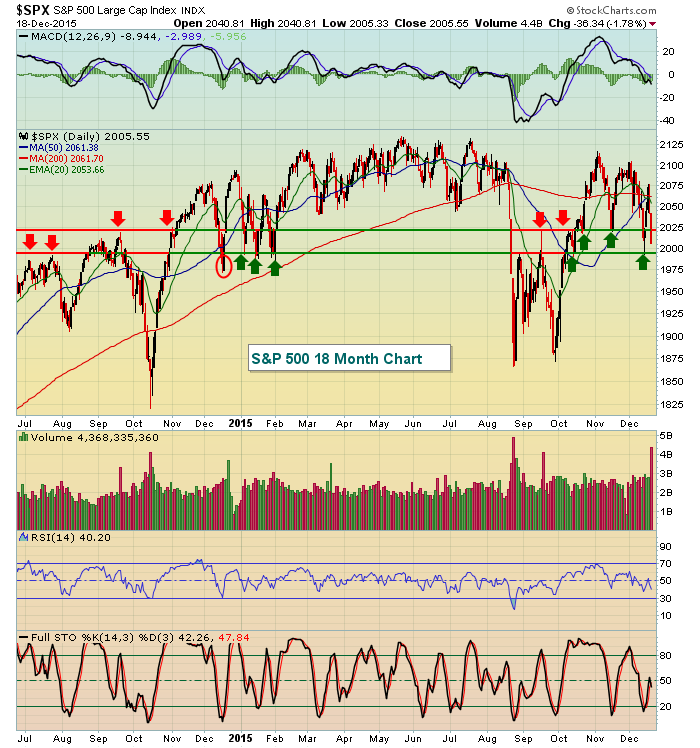
As I look at this chart, I see a number of short-term tops and bottoms that reverse either near 1995 or 2020. Those two levels are represented by the horizontal lines on the above chart. December 2014 (red circle) represented a bit of a head fake, but otherwise many turns in fortune for the bulls and bears occurred at 1995 or 2020. Note that Friday's big selloff finished right in the middle of this key zone. And 2015 has been the year of whipsaw action. Price action has been frustrating because neither strength nor weakness seems to last for very long so if you have the tendency to "chase" action, it's been a rough year as short-term trends haven't seemed to last. All of this action is occurring in a bullish long-term sideways consolidation. It's bullish because most consolidation patterns break in the direction of the prior trend, which was higher. Look at the longer-term chart pattern:
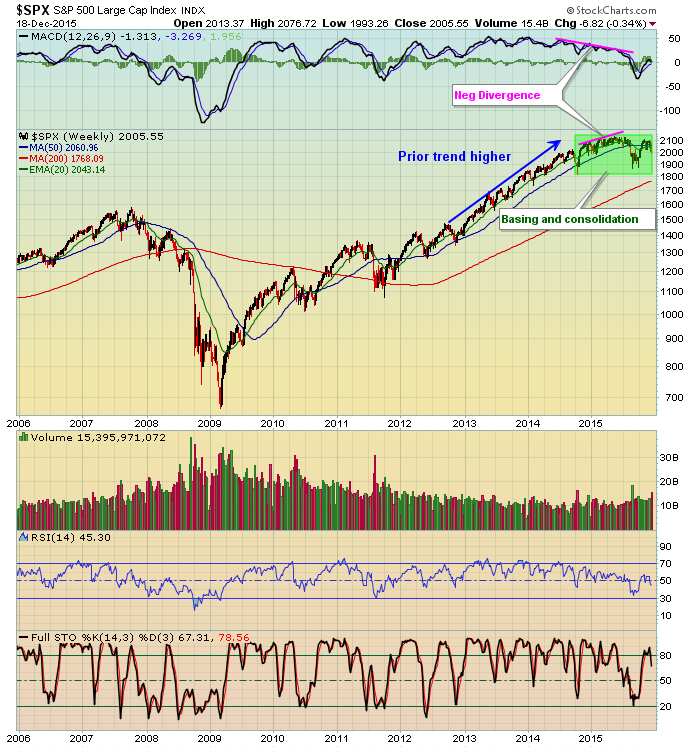
It's always important to keep things in perspective. Yes, the action in the U.S. stock market has been frustrating, but negative divergences on the weekly chart tells us we'll need patience. And check out the prior uptrend. It was uninterrupted for four years - since the 2011 correction. It was necessary to see consolidation and that's what 2015 produced. 1800-2131 is the current consolidation zone and until either support or resistance is lost, expect more of the same.
As for the action on Friday, all nine sectors finished lower as there really wasn't a safe haven to be found. Financials were the worst performing, dropping 2.67% as banks ($DJUSBK) reversed on Thursday and ended up giving away all of its earlier gains in the week - disappointing action, especially since the Fed began what's expected to be a series of rate hikes over the next 12 months. Higher rates typically produce higher profits for banks so the future price action in this influential industry group will be important to monitor.
Pre-Market Action
There are no economic reports so traders here in the U.S. will be looking at technical conditions and action overseas for direction. The good news is that Germany is showing strength again today after climbing back above the key 10500 level. One key this week and over the next several weeks will be the performance of transportation stocks ($TRAN) to utilities ($UTIL). We are at a major crossroads here on the BIG PICTURE charts. The 13 relative ratio line has been quite significant in marking a strengthening economy vs. a weaker one. December has been an absolutely awful month in terms of rotation away from the TRAN and into the UTIL and this really makes little sense if we listen to what the Fed is saying. They claim economic conditions have improved and they expect further improvement. If that's true, transports should outperform utilities - and by a wide margin. But the stock market tells us where MONEY is going, which is much more important than watching LIPS MOVE. Check out this relative chart:
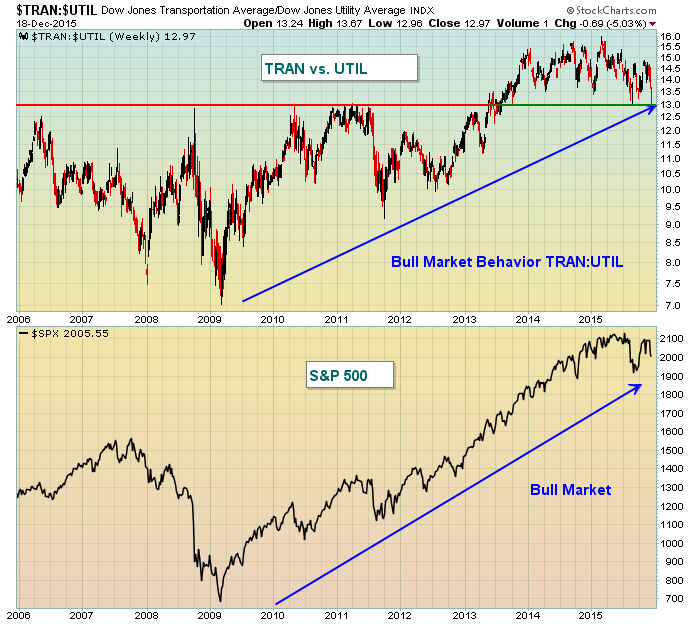
The long-term trend of the TRAN:UTIL fully supports the 7 year bull market. But the December relative weakness has sent this ratio down to a key test of 13 relative support. A bullish development would be to see this ratio rise off this relative support level. Failure to do so sends us a very mixed message - a bearish message. Of course, this is just one signal but it's a powerful one as transports should significantly outperform utilities in an environment where our economy is strengthening, as the Fed suggests.
U.S. futures are very strong this morning so we'll get our first clue as to what traders think of this TRAN:UTIL relationship. I'll be watching it closely.
Current Outlook
Despite the shortened holiday week, we'll get a number of economic reports that traders will need to analyze for purposes of evaluating possible Fed actions in 2016. Yes, the Fed raised interest rates for the first time in 9 years last week, but now the focus in that respect will be how many more hikes we'll likely see as the 2016 environment will be much different than 2015. This year it's been about IF and WHEN the Fed will raise. Now the question most traders will ask is HOW MANY hikes will we see? Two? Three? Four? More?
The 10 year treasury yield ($TNX) will be my "go to" in terms of expectations. The bond market generally does an excellent job of interpreting economic reports and forecasting Fed actions. The TNX fell dramatically in the big picture and the downtrend has plenty of room to the upside for the Fed's 2016 actions and still remain in a downtrend. Take a look at the long-term trend of interest rates:
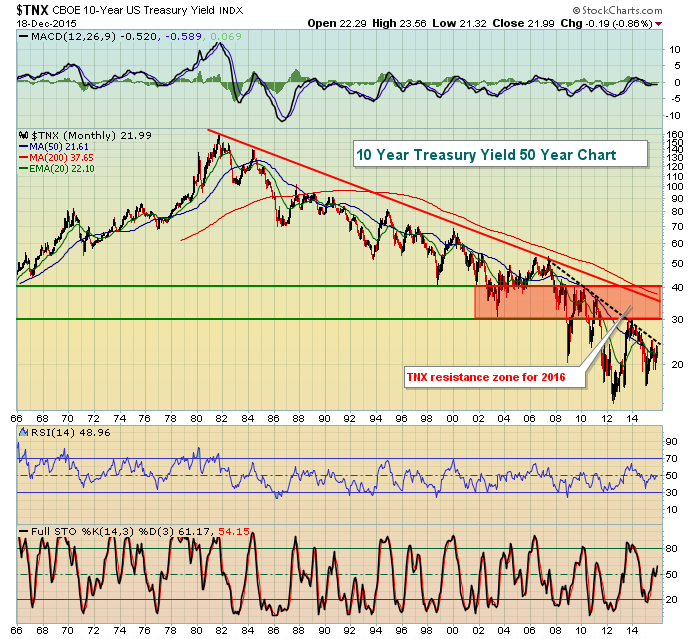
I've provided an area of resistance (3%-4%) - both yield resistance and trendline resistance that I'll be watching. I suspect we'll see the TNX rise to at least 3% in 2016. Because interest rates have remained historically low, a rise to this resistance zone shouldn't be seen as problematic for equities. If rates continue rising, it's a sign of improving economic conditions and that economic strength should have no problem handling the higher rates associated with that growth. In other words, if the stock market rises, I wouldn't view rising rates as a negative or as a headwind to strength in equities. The black dotted line in the chart above connects reaction highs in yields over the past eight years. A break above 2.50% likely confirms the next move in yields into that 3%-4% zone.
Sector/Industry Watch
Since it's Christmas week, let's take a look at the retail space. You might be surprised, but retail historically performs best AFTER the holiday season ends. That could be important because technically the group has been challenged as you can see from the chart below:
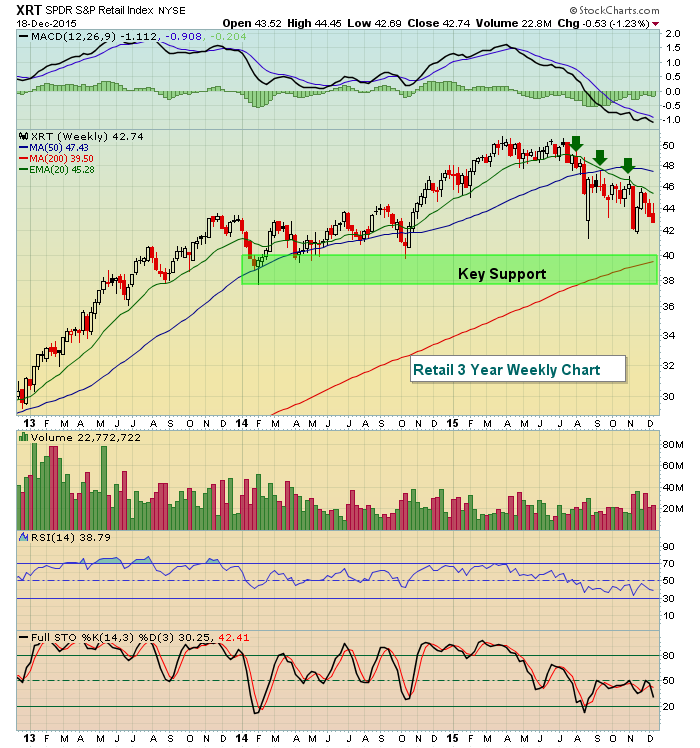
Using the seasonality tool here at StockCharts.com, the XRT's best three consecutive months runs from February through April, not October through December as you might expect. Therefore, it seems as though the recent weakness could be providing us an opportunity as we enter a brand new year.
Historical Tendencies
Here are the annualized returns for each day this week on the S&P 500 (since 1950):
December 21 (today): +73.92%
December 22 (Tuesday): +35.88%
December 23 (Wednesday): +3.79%
December 24 (Thursday): +48.27%
December 25 (Friday): Christmas Day (U.S. markets closed)
From December 21 to December 24, the S&P 500 has risen 106 days and fallen 68 days since 1950. Historically, we've seen a much better chance of an up day throughout this period than we typically see throughout the year. However, there have been plenty of down days as well so don't view this as a guarantee. Instead, it just suggests to us that the "tendency" is for the S&P 500 to move higher during Christmas week.
Key Earnings Reports
(reports after today's close, estimate provided):
CTAS: 1.00
Key Economic Reports
None
Happy trading!
Tom
