Market Recap for Tuesday, December 22, 2015
Tuesday's action was bullish on a few fronts. First, it was a trend day where we saw buying throughout. The last time that happened was December 4th, nearly three weeks ago. Second, the rally was led by industrials (XLI) which gained 1.38%. Industrials were one of four sectors gaining at least 1% and all nine sectors rose. We haven't seen too many days recently with widespread buying. Perhaps more important were the gains generated by railroads ($DJUSRR). This has been one area of major concern as weakness in this group inspires little confidence in a strengthening U.S. economy. The DJUSRR does show a long-term positive divergence on its weekly chart and Tuesday's 2.28% was railroad's strongest daily performance since this time last month. Here's a visual of the positive divergence:
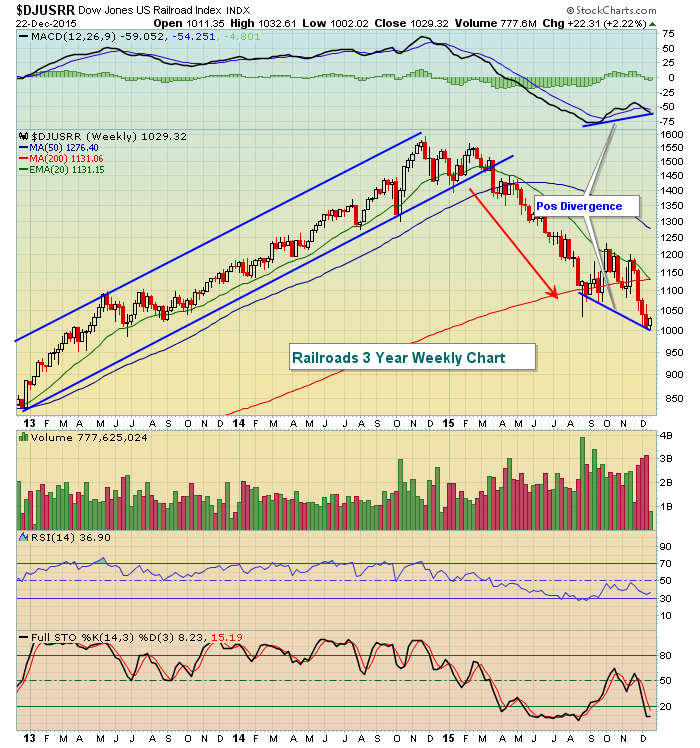
I prefer to see a reversing candle or slowing volume on the fresh lows to support the slowing momentum theory provided by the MACD. In this case, we have neither yet so a long position here does represent higher risk. Seasonally, the DJUSRR tends to follow the S&P 500's historical lead as it typically rises from October through May. Now that we're a couple months into this period and the positive divergence has emerged, maybe this is the beginning of an uptrend here. The Fed has us believing that our economy will improve in 2016. If that's the case, the 2015 weakness in railroads should provide a nice opportunity for outsized gains next year.
A common theme in December has been the rotation away from aggressive areas of the market. That continued to some degree with yesterday's bullish action. The consumer staples (XLP) sector gained 1.30% while its consumer discretionary (XLY) counterpart rose just .73%. The longer-term trend in the XLY:XLP is clearly higher, but this ratio is testing key 2015 relative support. First, let's look at the big picture:
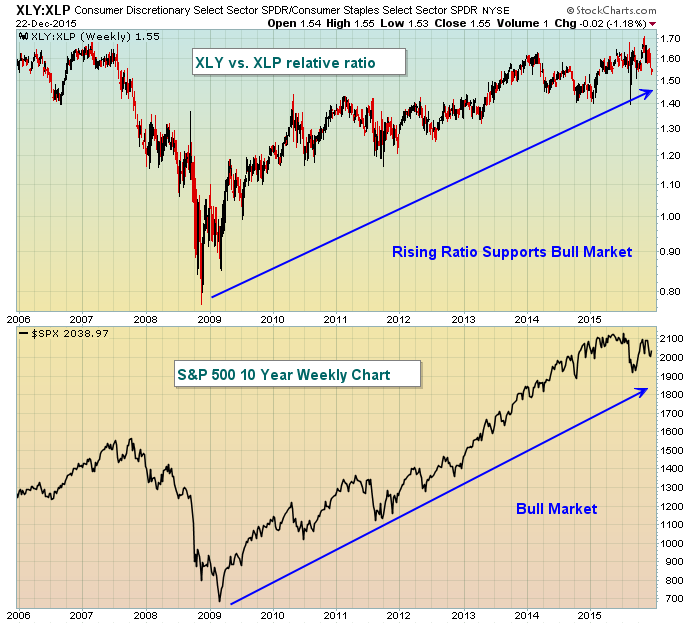
This long-term chart of the XLY:XLP is one of the most bullish charts and it suggests this bull market remains sustainable. But................
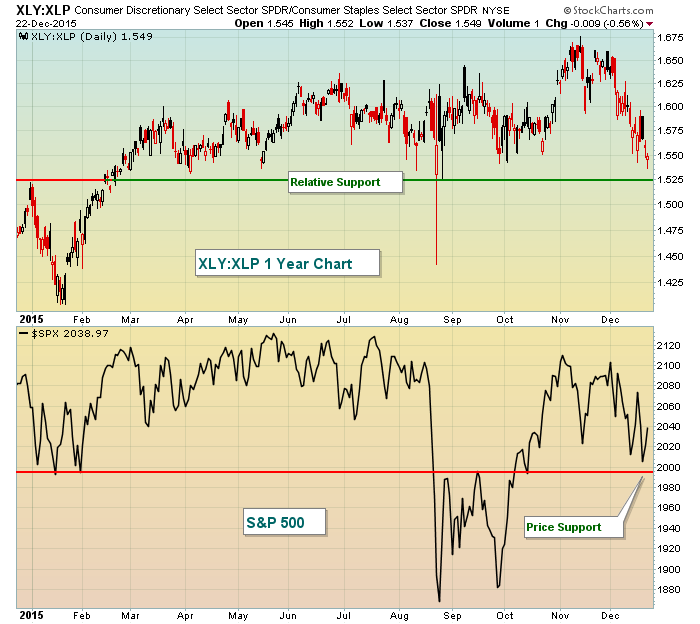
As long as price support on the S&P 500 holds at 1995 and the relative support on the XLY:XLP holds near 1.53, I can make a bullish argument for U.S. equities. Failing to hold those levels, however, would add to the bearish argument. Transportation outperformed utilities ($TRAN:$UTIL) the past two days after this ratio fell to a very critical relative support level at 13. I'd look for a similar relative bounce in the XLY:XLP if the 1.53 relative support level is reached.
Pre-Market Action
U.S. futures are on the rise this morning, adding to gains this week. Asian markets were mixed, but action in Europe this morning has been very positive with key indices there up close to 2%. That action, along with another rise in the 10 year treasury yield ($TNX), has traders confident as we begin today's session. Typical bullish behavior in the second half of December likely isn't hurting either.
Should the recent strength continue in December and possibly January, it will be VERY important to see what leads this rally as money has been rotating into defensive areas of the market and that needs to end if the 7 year bull market is to be sustained.
Current Outlook
The bulls have been waiting patiently for Santa Claus' 2015 debut. Typically we see tons of equity strength this time of year, but until Monday that historical strength has been M.I.A. The S&P 500 closed out November at 2080 and after Tuesday's nice gains still remains well below that level at 2039. We do have more than a week of trading left in 2015 and the days remaining represent the most bullish time of the month (see the Historical Tendencies section below for more details). Tendencies do not equate to guarantees and we've witnessed deterioration in U.S. equities recently - both in terms of absolute price performance and also "under the surface" signals. So this is not a slam dunk. It's comforting to see transports regain strength vs. utilities this week and it was also very nice to see the selling of treasuries yesterday. But there's much more work to do.
The S&P 500 tends to follow the 10 year treasury yield ($TNX) and that yield is on the rise today, adding to the strength Tuesday. That bodes well for further gains in the U.S. equity market today. Here's a quick reminder on an intraday chart of the parallels between these two markets:
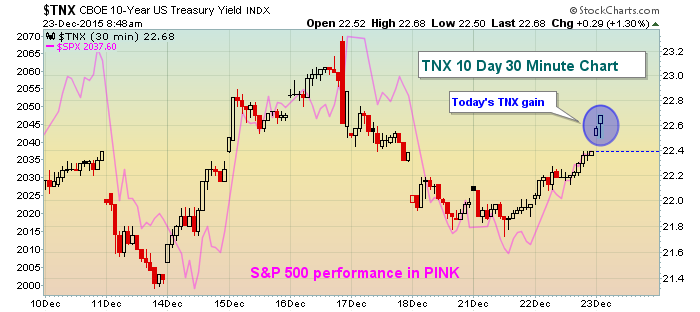
That pink line (S&P 500) tends to mirror movement in the TNX. Why? Because selling in treasuries sends the TNX higher - always an inverse relationship there. Selling in treasuries also generates proceeds that are normally reinvested in equities. In other words, it provides cash flow necessary to drive equity prices higher.
Sector/Industry Watch
I'm looking for a rally into year end on the home construction industry ($DJUSHB) and this week's action could be the start. Yesterday, existing home sales came in well short of expectations and yet the DJUSHB rose 1.23%. Furthermore, earlier weakness in December had taken this group down near significant price support in the 550-570 area. Below is a 3 month hourly chart that shows the group has potentially begun an uptrend from support. Watch for the trendline break to confirm:
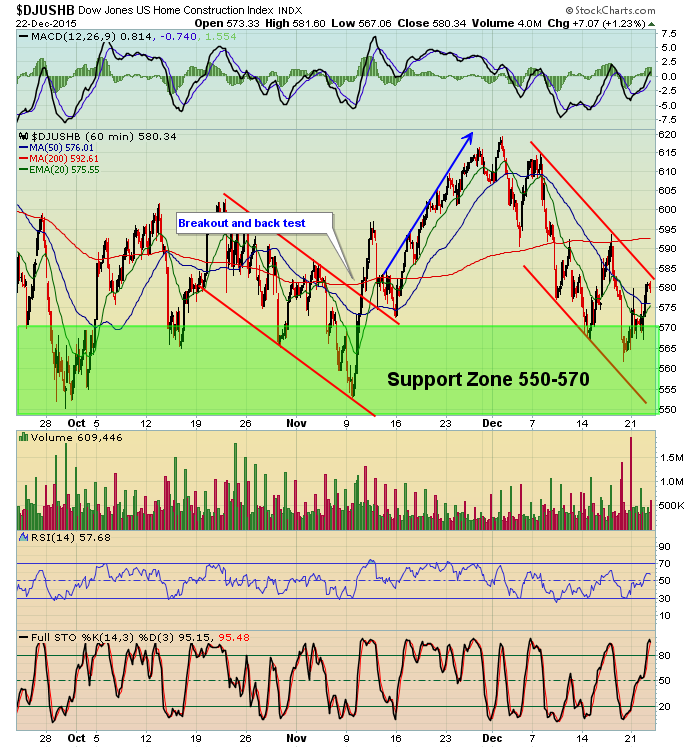
Home construction typically rises during December. In fact, its average December return is 5.6% making it the best month of the year for this industry group. Over the past 16 years, December has been higher for the group 12 times, or 75%. Using the seasonality tool here at StockCharts.com, December is the best month for home construction. Looking at the chart thus far in December 2015, however, you can see the group has been under intense selling pressure. Given the bullish seasonal trends and recent price support in the 550-570 zone, I expect to see a year end rally here. We'll see.
Historical Tendencies
Today, I'll focus on the annualized returns of the Russell 2000 (since 1988). The following is a breakdown of those returns by calendar day of the month through December 31:
December 21 (Monday): +172.01%
December 22 (yesterday): +84.35%
December 23 (today): +89.20%
December 24 (Thursday): +47.99%
December 25 (Friday): Christmas Day, U.S. markets closed
December 28 (next Monday): +41.72%
December 29 (next Tuesday): +69.26%
December 30 (next Wednesday): +114.15%
December 31 (next Thursday): +124.57%
I've discussed the amazing historical strength that we've seen across our major indices from December 21 to December 31 and the fact that the Russell 2000 tends to be the strongest of our indices during the month of December. Check out those annualized returns on small caps. The LOWEST return of any day throughout this period is +41.72%. That's serious historical strength. While it guarantees us nothing, it'd be difficult for me to short anything during this period given those numbers.
The last two days I provided similar annualized returns for the S&P 500 (Monday's blog article) and the NASDAQ (Tuesday's blog article). The stock market has shown historical tendencies to rise into year end and this year is setting up to do the same.
Key Earnings Reports
None
Key Economic Reports
November durable goods released at 8:30am EST: +0.0% (actual) vs. -0.5% (estimate)
November durable goods ex-transports released at 8:30am EST: -0.1% (actual) vs. +0.0% (estimate)
November personal income released at 8:30am EST: +0.3% (actual) vs. +0.2% (estimate)
November personal spending released at 8:30am EST: +0.3% (actual) vs. +0.3% (estimate)
November new home sales to be released at 10:00am EST: 503,000 (estimate)
December consumer sentiment to be released at 10:00am EST: 92.0 (estimate)
Happy trading!
Tom
