Archived News
StockCharts In Focus1w ago

Stay Ahead of the Markets with AUTOMATED Portfolio Reports
Staying on top of your portfolio in a fast-moving market can be a challenge. On this week's edition of StockCharts TV's StockCharts in Focus, Grayson shows you how to make things easier on yourself with automated ChartList Reports for your portfolio Read More
The MEM Edge1w ago
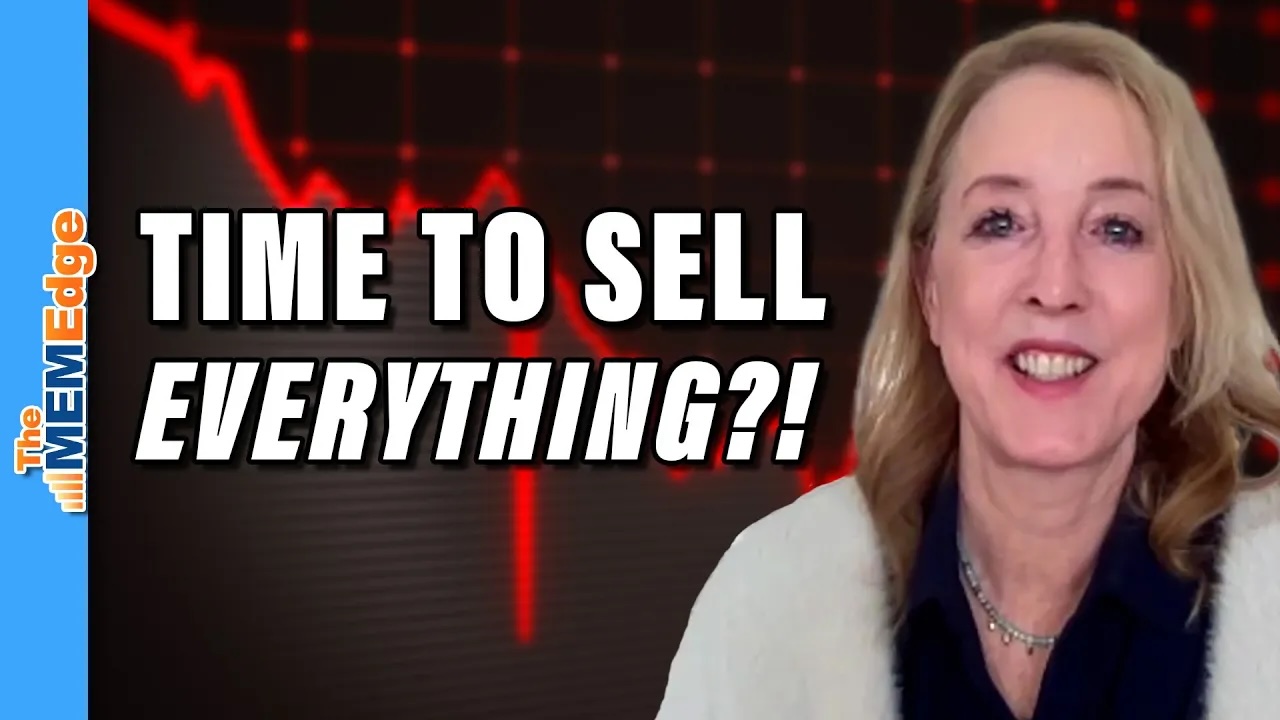
MEM TV: Time To SELL EVERYTHING?!
In this episode of StockCharts TV's The MEM Edge, Mary Ellen shares key signals that it's time to sell a stock, using INTC as an example. She also reviews a key area of support for the markets, and new sectors that have entered a downtrend Read More
ChartWatchers1w ago
Stock Market Indexes Plunge After Hitting Resistance -- Support Levels You Need to Watch
Now that earnings season has begun, what can you expect the stock market to do, especially after its stellar Q1 run? Well, after a few months singing the monotone "up, up, up" tune, the stock market has mixed things up a little. Now you hear "up, down, up, down Read More
Members Only
Martin Pring's Market Roundup1w ago
The Day the Yields Broke Out
Wednesday brought an unexpected firming up of the inflation figures, causing analysts and commentators to trim the number of times they expect interest rates to be cut this year Read More
Art's Charts1w ago
Using Outsized Moves to Identify Trend Reversals - Checking in on Housing and Semis
Trends often start with outsized moves. But how do we measure and identify such moves? Chartists can measure moves in Average True Range (ATR) terms using the ATR Trailing Stop SAR indicator (ATR-SAR). ATR is a volatility indicator developed by Welles Wilder Read More
ChartWatchers1w ago

From Relic To Reckoning: Can Gold Surge To $3,000?
The strange thing about gold is that it's always a relic until it isn't. And when it isn't, everyone swears it's always been an alternative currency (why would anyone have thought it was a relic in the first place?) Read More
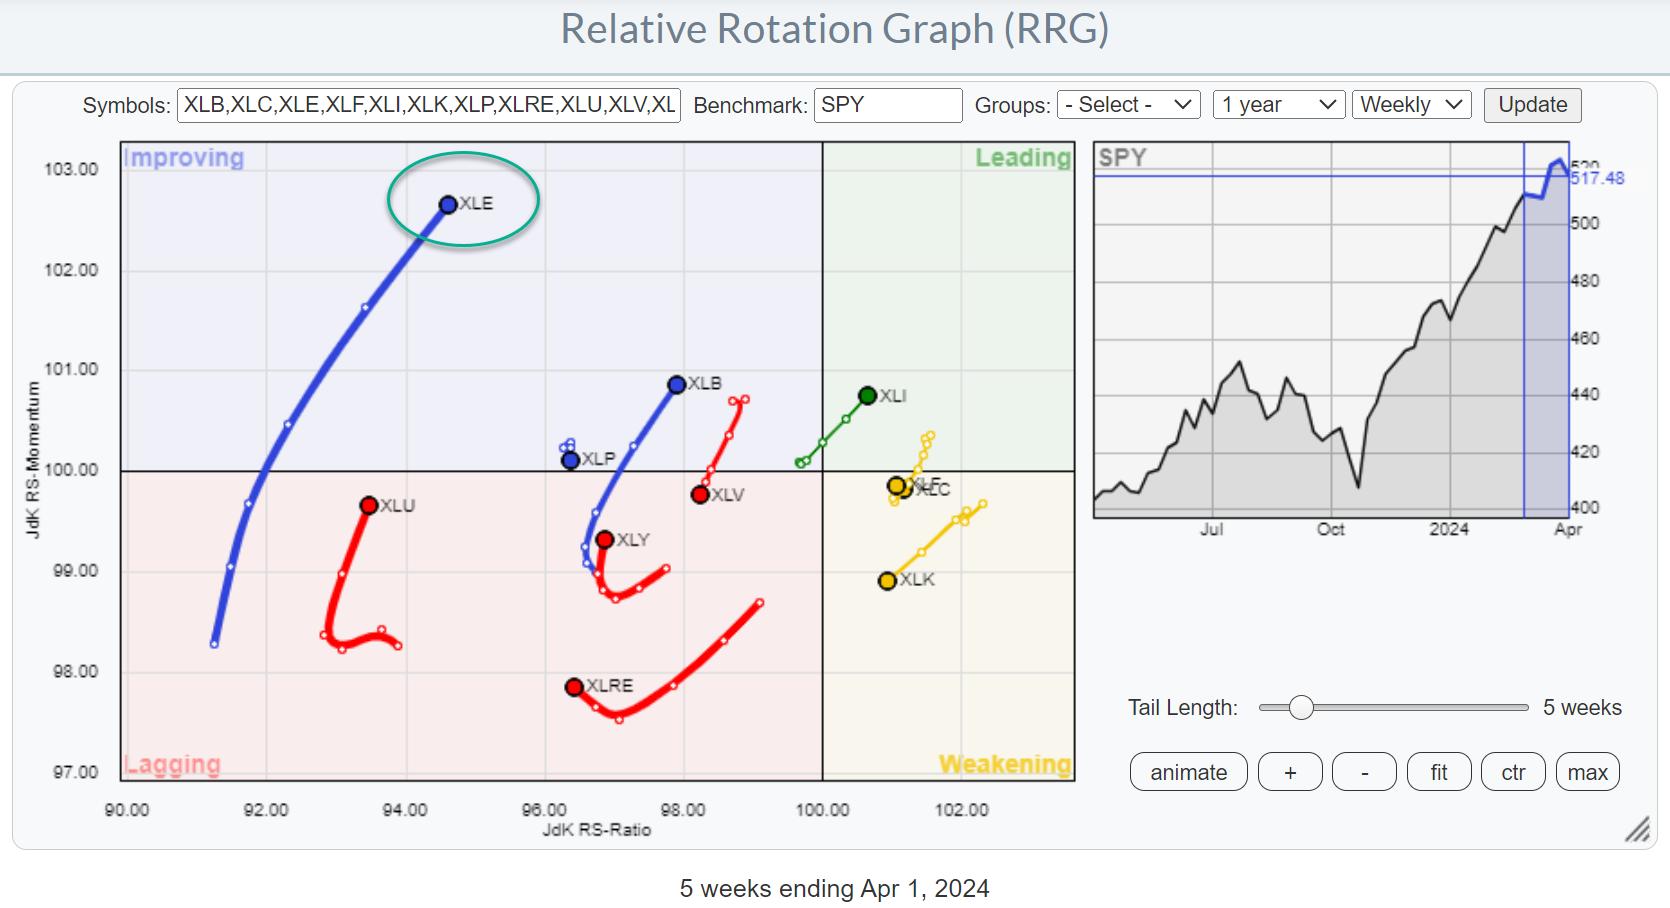
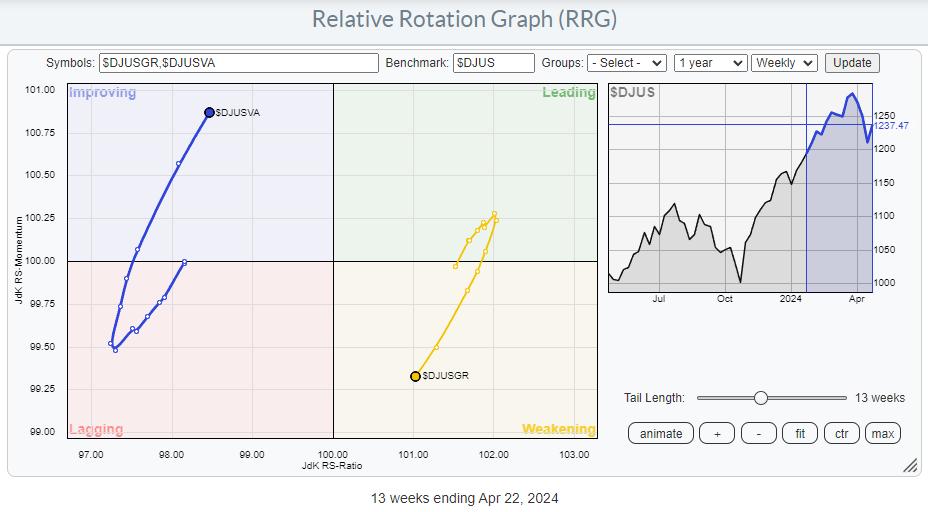
RRG Charts2w ago

RRG Indicates That Non-Mega Cap Technology Stocks are Improving
A Sector Rotation Summary A quick assessment of current sector rotation on the weekly Relative Rotation Graph: XLB: Still on a strong trajectory inside the improving quadrant and heading for leading Read More
Don't Ignore This Chart!2w ago

NVDA is Holding Strong: It's Time to Think About Accumulating this Stock
Sometimes, it helps to look at a stock like NVDA to get a pulse of the market. NVDA's stock price is up over 85% in 2024. It's a leader in the AI ecosystem and the most talked-about stock Read More
Stock Talk with Joe Rabil2w ago
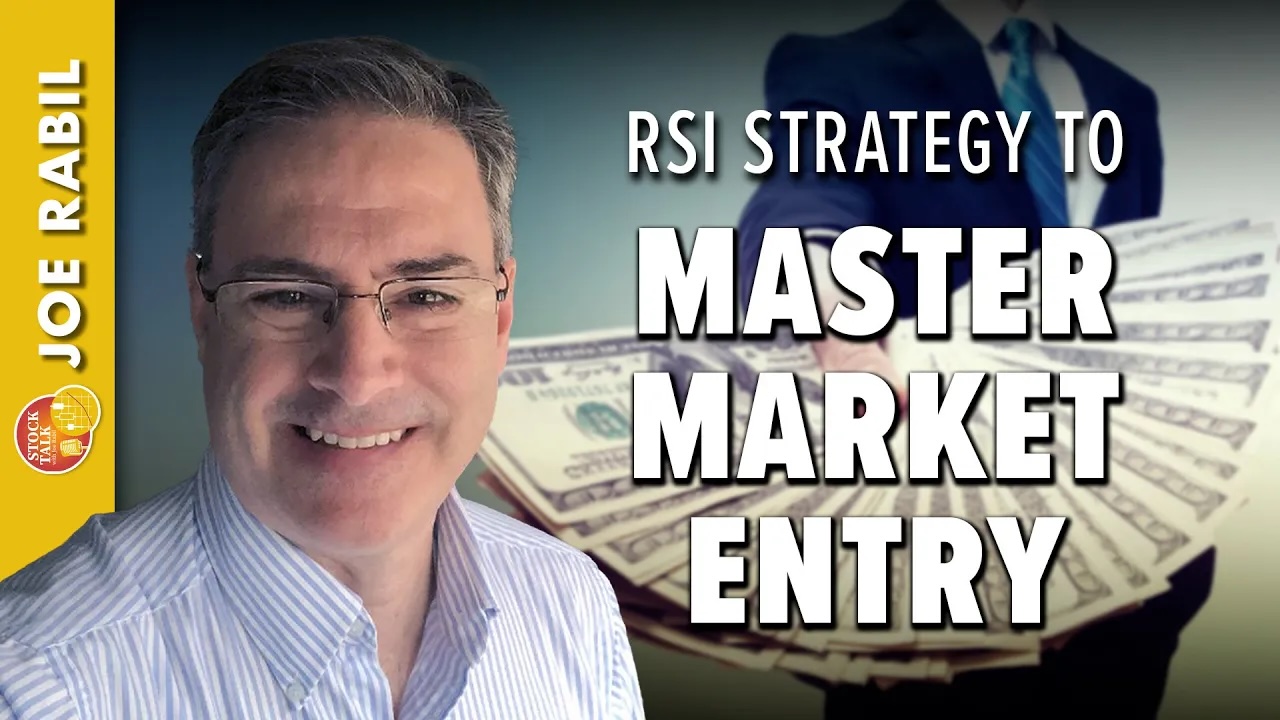
Master Market Entry with This RSI Strategy!
On this week's edition of Stock Talk with Joe Rabil, Joe explains how to use the RSI along with the MACD and ADX indicators. RSI is used as a timing tool when things are lined up Read More
Dancing with the Trend2w ago
Market Research and Analysis - Part 5: Drawdown Analysis
Note to the reader: This is the sixteenth in a series of articles I'm publishing here taken from my book, "Investing with the Trend." Hopefully, you will find this content useful Read More
DecisionPoint2w ago
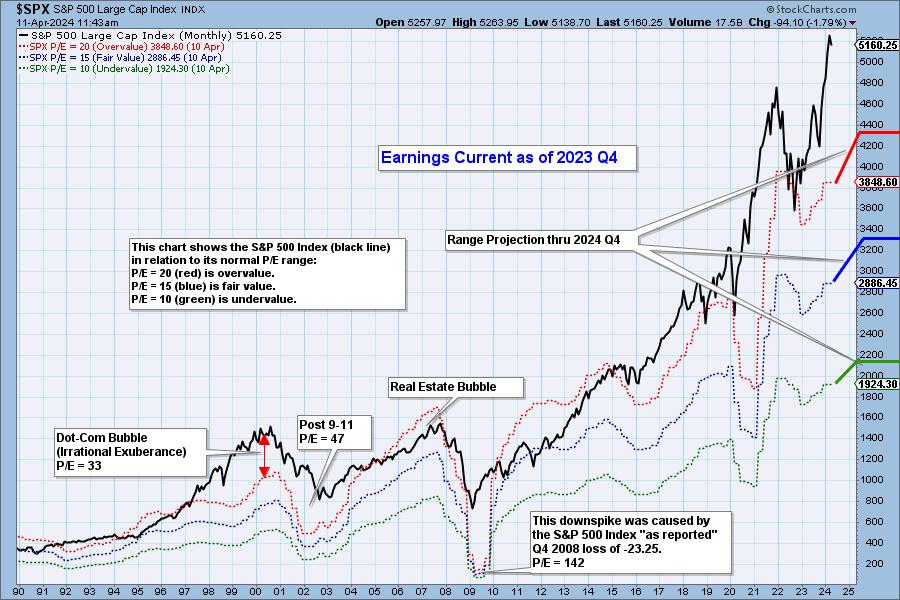
2023 Q4 Earnings Analysis and Projections Through 2024 Q4
S&P 500 earnings are in for 2023 Q4, and here is our valuation analysis Read More
ChartWatchers2w ago
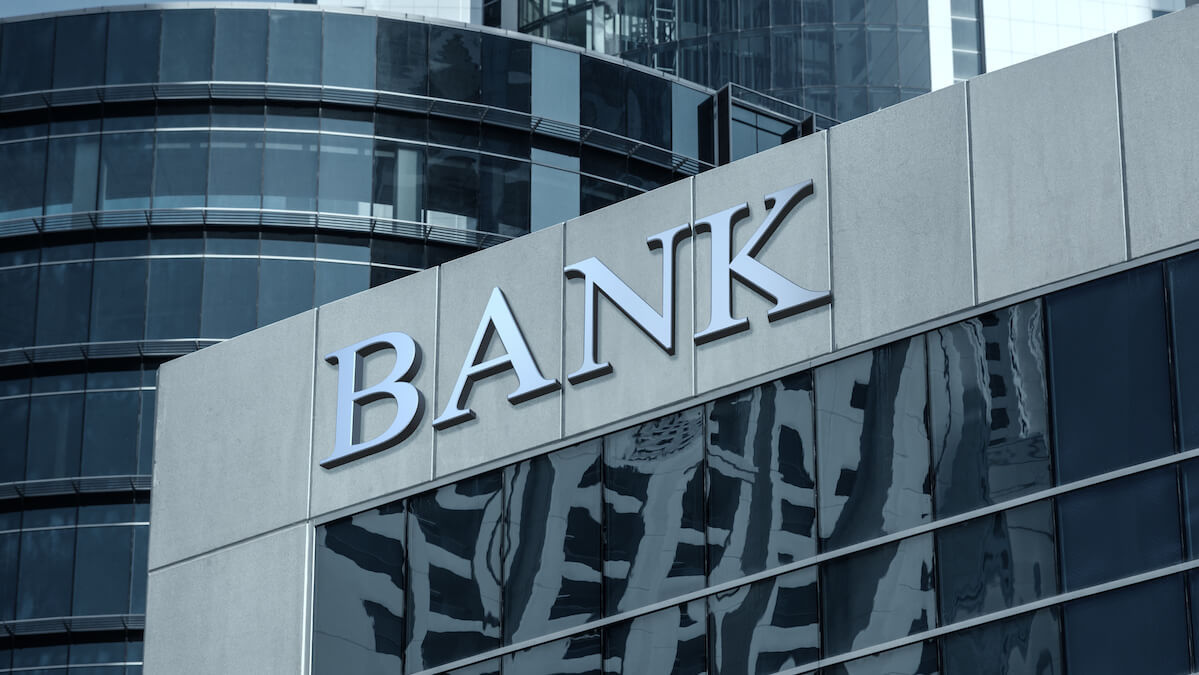
Is the Banking System on the Verge of Systemic Implosion? What to Look Out For
2024 will be marked by a massive string of bank failures!!! Well, according to a few economists on the far end of the mainstream economic spectrum, that is Read More
Members Only
Martin Pring's Market Roundup2w ago
This Sector is Breaking Up and Down Simultaneously
This may seem like a contradiction, but it is possible for two different things to be true at the same time Read More
The Final Bar2w ago
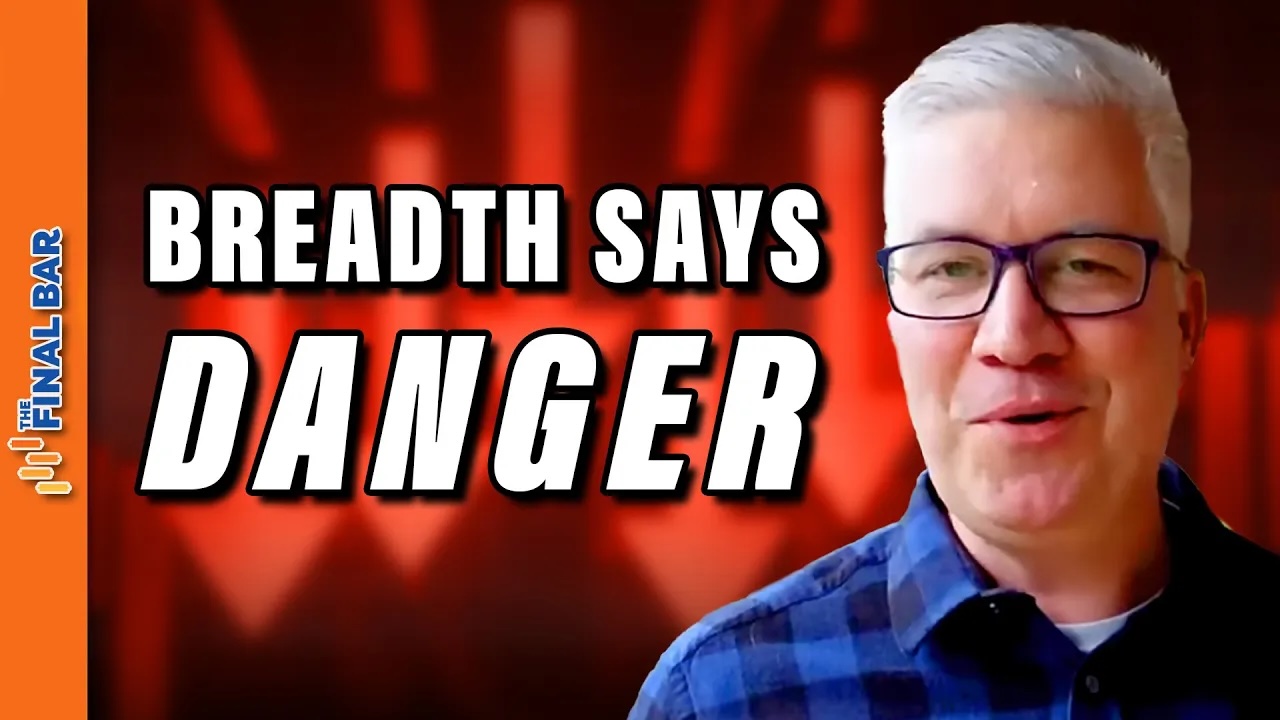
Despite Stable Markets, Breadth Says Danger
In this edition of StockCharts TV's The Final Bar, Dave drops a market update, with a focus on Bitcoin's rebound above 70K, deteriorating short-term breadth conditions, and stocks still making new highs despite the market consolidation phase Read More
Trading Places with Tom Bowley2w ago
2 Consolidating Stocks Ready To Resume Their Uptrends
My preference is to trade strong stocks that are simply consolidating and ridding themselves of weak hands, hopefully just in time to ride the next wave higher Read More
Analyzing India2w ago
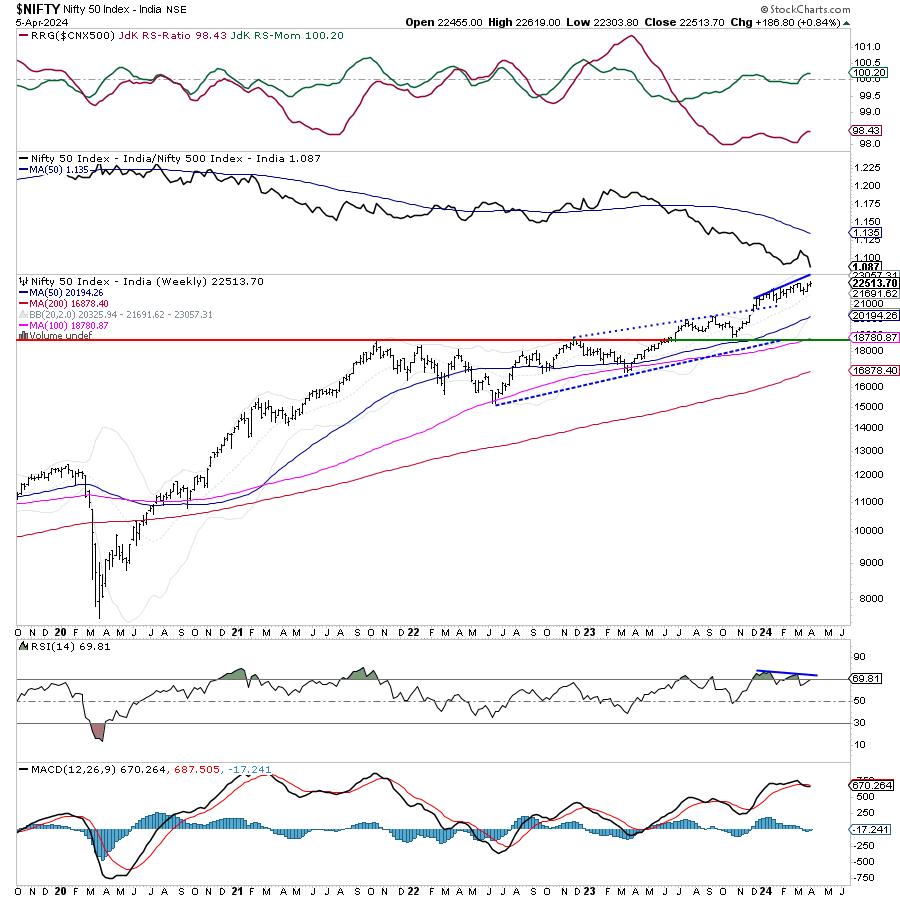
Week Ahead: NIFTY May Continue Finding Resistance at Higher Levels; These Sectors May Relatively Outperform
In the previous technical note, it was categorically mentioned that, while the markets may attempt to inch higher, they may not form anything beyond minor incremental highs and could largely continue to stay under consolidation Read More
The MEM Edge2w ago

MEM TV: Is It Safe To Reenter The Markets?
In this episode of StockCharts TV's The MEM Edge, Mary Ellen shares what to be on the lookout for to tell if it's safe to put new money to work. She also shares the weakness in select sectors and which areas she suggests to underweight Read More
The Final Bar2w ago
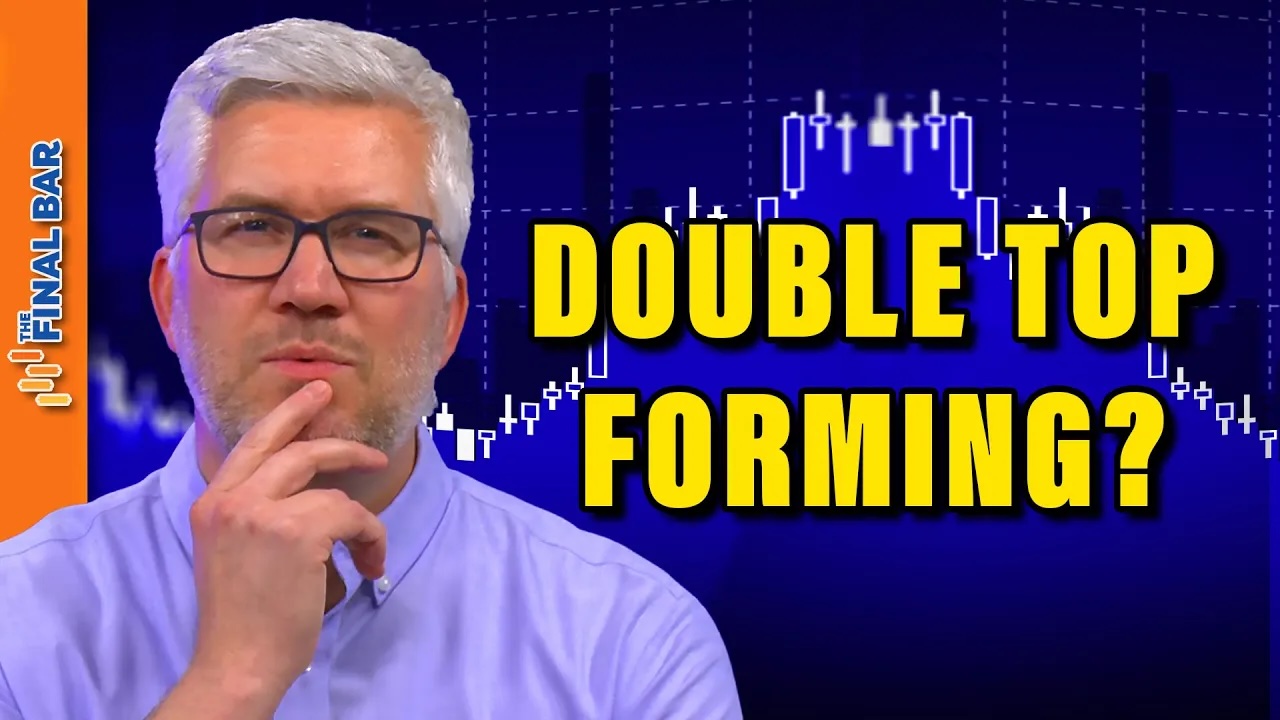
Double Top Forming in Growth vs. Value?
In this edition of StockCharts TV's The Final Bar, Dave answers questions from The Final Bar Mailbag. Today he talks about how to use the ADX indicator, how growth vs Read More
The Mindful Investor2w ago
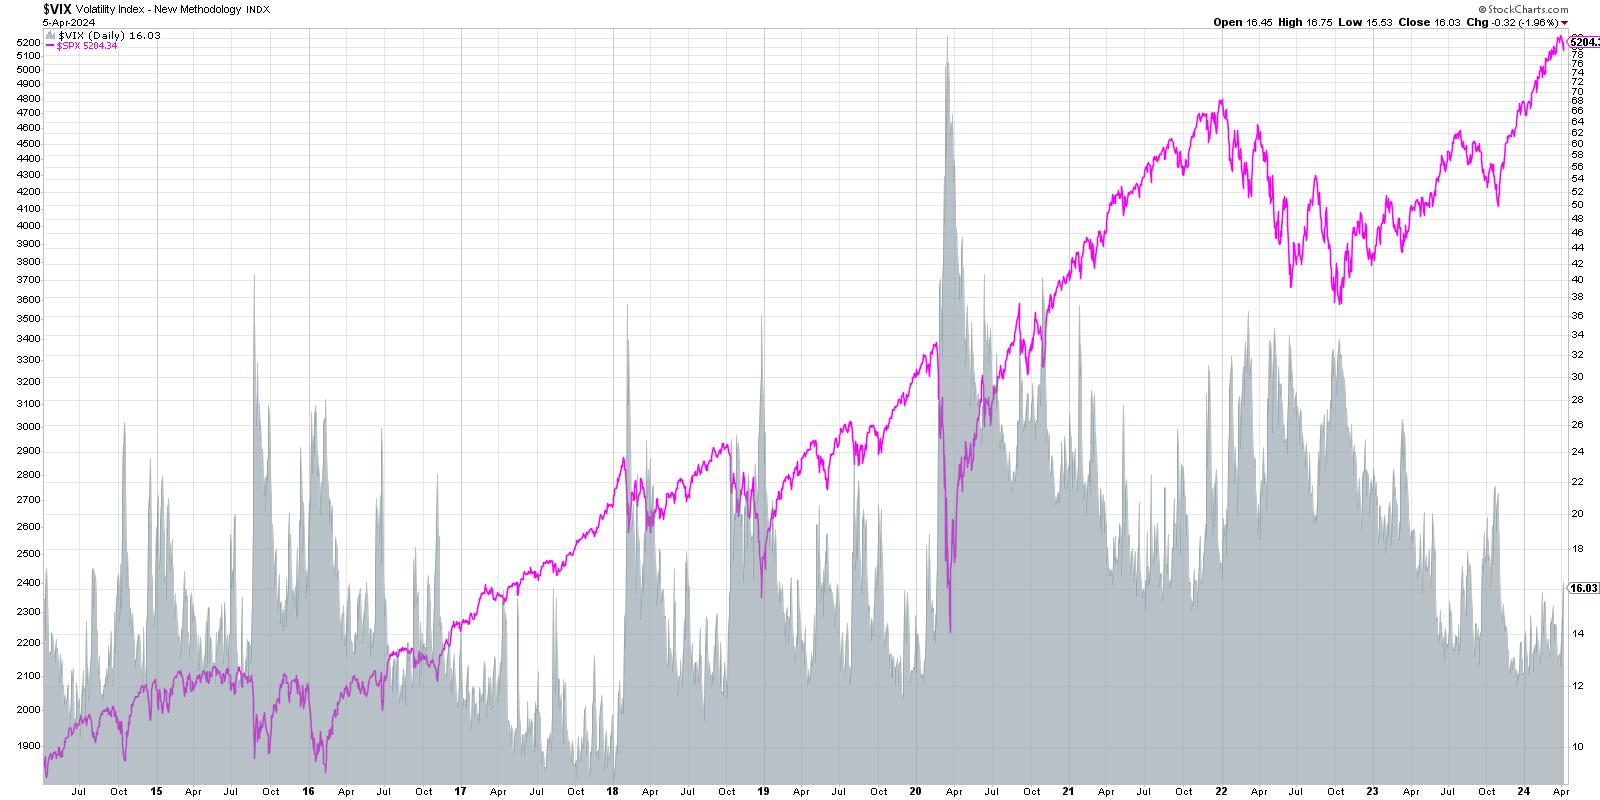
VIX Spikes Above 16 - Is This the End?
The VIX ended the week just above 16, bringing it to its highest level in 2024 Read More
ChartWatchers2w ago

Jobs In the Spotlight: Stock Market Reverses Course After Massive Selloff
One day doesn't make a trend—that's one lesson we learned from this week's stock market action. The March non-farm payrolls data revealed that the US economy added 303,000 jobs, which is higher than the estimated 200,000. Additionally, the unemployment rate dropped to 3 Read More
RRG Charts2w ago
Energy is on Fire
Strong Rotation on the Weekly RRG For a few weeks now, the improvement in the energy sector (XLE) is becoming increasingly visible in the lengthening of the XLE tail on the Relative Rotation Graph Read More
Wyckoff Power Charting2w ago

Trifecta of Trouble
The Markup Phase of a Bull Market is glorious to behold and participate in. But they do ebb and flow. The bullish run in the major stock indexes has been persistent in 2024 Read More
ChartWatchers2w ago
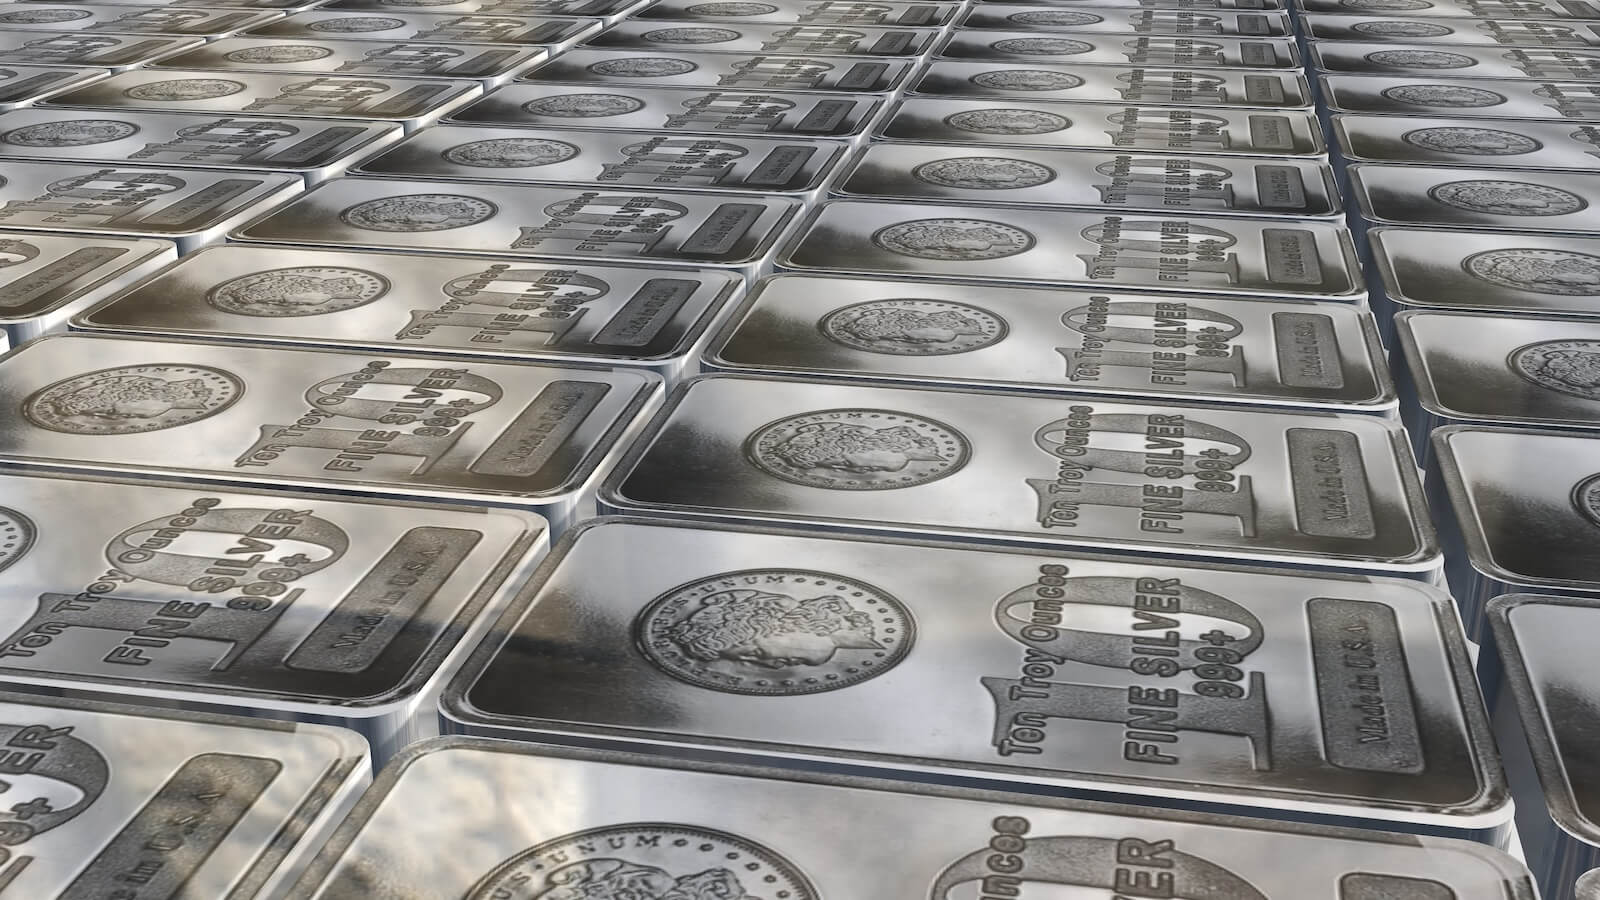
Silver's Surge: Can It Reach $50 an Ounce This Year?
The likelihood of silver reaching $50 an ounce this year is a ‘real possibility,' according to analysts. More conservative yet bullish forecasts plot silver's target range between $35 and $50 Read More
The Final Bar3w ago
Two Options Plays Amid Market Selloff
In this edition of StockCharts TV's The Final Bar, Dave welcomes Sean McLaughlin of All Star Charts. Sean shares his outlook for the Ark Innovation Fund (ARKK) and energy stocks (XLE) and how to employ options strategies to bet on particular outcomes Read More
Stock Talk with Joe Rabil3w ago
Spot Big Reversals Using the ADX Indicator
On this week's edition of Stock Talk with Joe Rabil, Joe demonstrates how to use the "Big Green Bar" candlestick pattern. This candlestick provides great confirmation on certain types of entry points, and can also be helpful for exits Read More
Dancing with the Trend3w ago
Market Research and Analysis - Part 4: Trend Analysis Continued
Note to the reader: This is the fifteenth in a series of articles I'm publishing here taken from my book, "Investing with the Trend." Hopefully, you will find this content useful Read More
ChartWatchers3w ago

The Stock Market's Tremendous Resilience: What This Means For Q2
Even though the broader stock market showed signs of pulling back, so far, signs don't show that it's time to panic. The S&P 500 ($SPX) was up 10.6%, the Dow Jones Industrial Average ($INDU) was up 5.6%, and the tech-heavy Nasdaq was up over 9% in Q1 2024 Read More
The Final Bar3w ago

These Sectors are Poised to Lead in Q2
In this edition of StockCharts TV's The Final Bar, Dave welcomes Mish Schneider of MarketGauge as she walks through charts of the Swiss Franc, solar stocks, and uranium, with a focus on price momentum and multiple time frame analysis Read More
The Final Bar3w ago
Top Two Sectors to Watch in April 2024
In this edition of StockCharts TV's The Final Bar, Dave welcomes guest Joe Rabil of Rabil Stock Research, who shares two sectors, Energy and Materials, where he sees upside potential given the recent upswing in commodity prices Read More
The Final Bar3w ago
Should You be Concerned About These Four Stocks?
In this edition of StockCharts TV's The Final Bar, Dave and guest Julius de Kempenaer of RRG Research talk sector rotation, growth vs. value, offense vs. defense, and an outlook for the US equity markets as we begin Q2 2024 Read More
Members Only
Martin Pring's Market Roundup3w ago
DJT Has Closed Last Week's Gap, But is It Enough?
Sometimes, simple indicators like bar or candlesticks operate just as the textbooks tell us they should Read More
DecisionPoint3w ago
DP Trading Room: On-Balance Volume (OBV) Explained
Today Carl and Erin cover the topic of On-Balance Volume (OBV) as a representation of volume trends. This came to their attention as they uncovered an OBV negative divergence on the SPY chart Read More
Members Only
Larry Williams Focus On Stocks3w ago
Business Confidence and Stocks | Focus on Stocks: April 2024
Trading Places with Tom Bowley3w ago
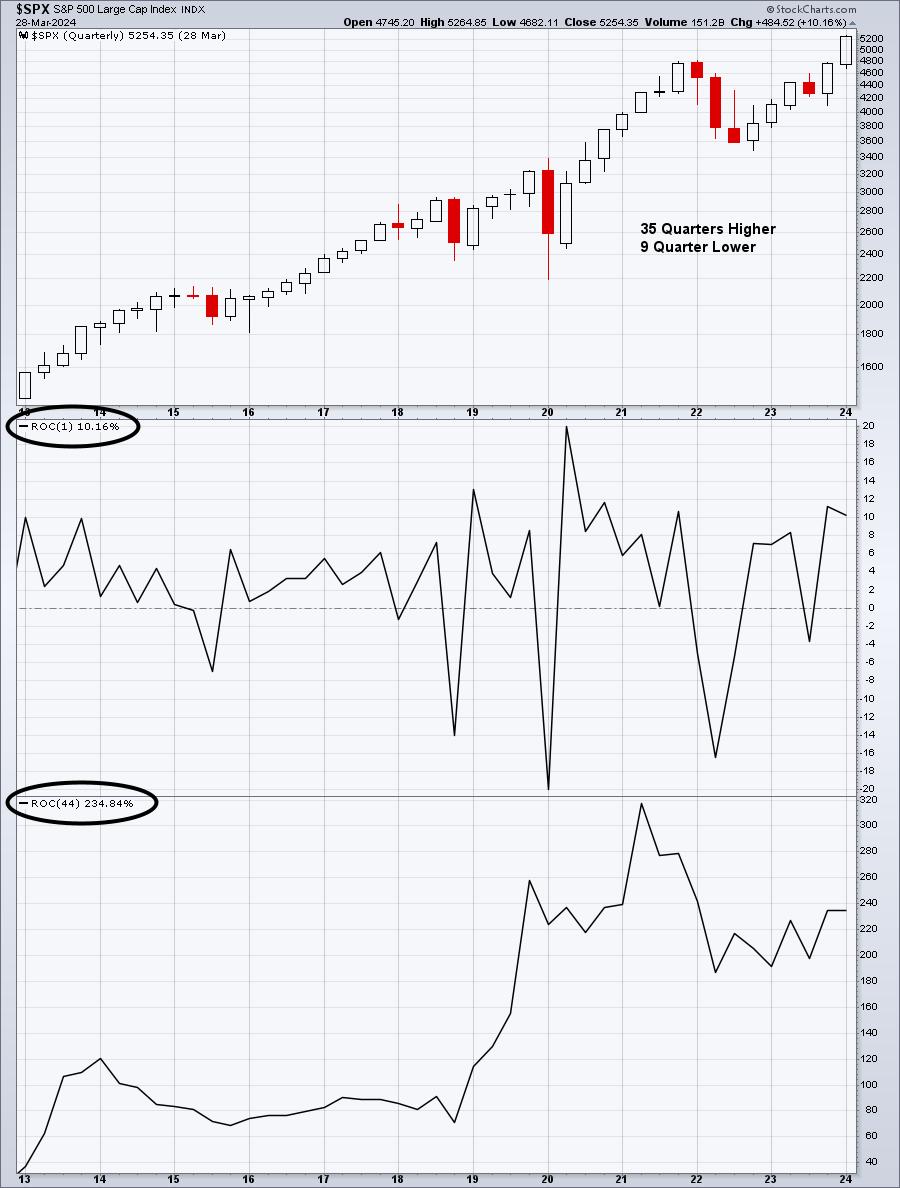
Q1 Ends With A Small Cap Attack! One Small Cap Sector is EXPLODING Higher!
Let's start off by reviewing a quarterly chart of the S&P 500 ($SPX), NASDAQ 100 ($NDX), and Russell 2000 (IWM) since this secular bull market began in early-April 2013 (44 quarters ago): S&P 500: NASDAQ 100: Russell 2000: When you look at these 3 charts, an obvious first conclus Read More
Art's Charts3w ago
Overbought Conditions Reflect Strength and Said Strength Drives Momentum Rotation Strategies
Momentum and trend strategies are off to a roaring start here in 2024. More often than not, these strategies buy leading stocks that appear overbought Read More
The MEM Edge3w ago
Core PCE Data Has Powell Pleased - May Set Tone For Q2
The Fed's preferred gauge of inflation was released today and, according to Fed chief Jerome Powell, "it was good," as there were no ugly surprises Read More
The MEM Edge3w ago
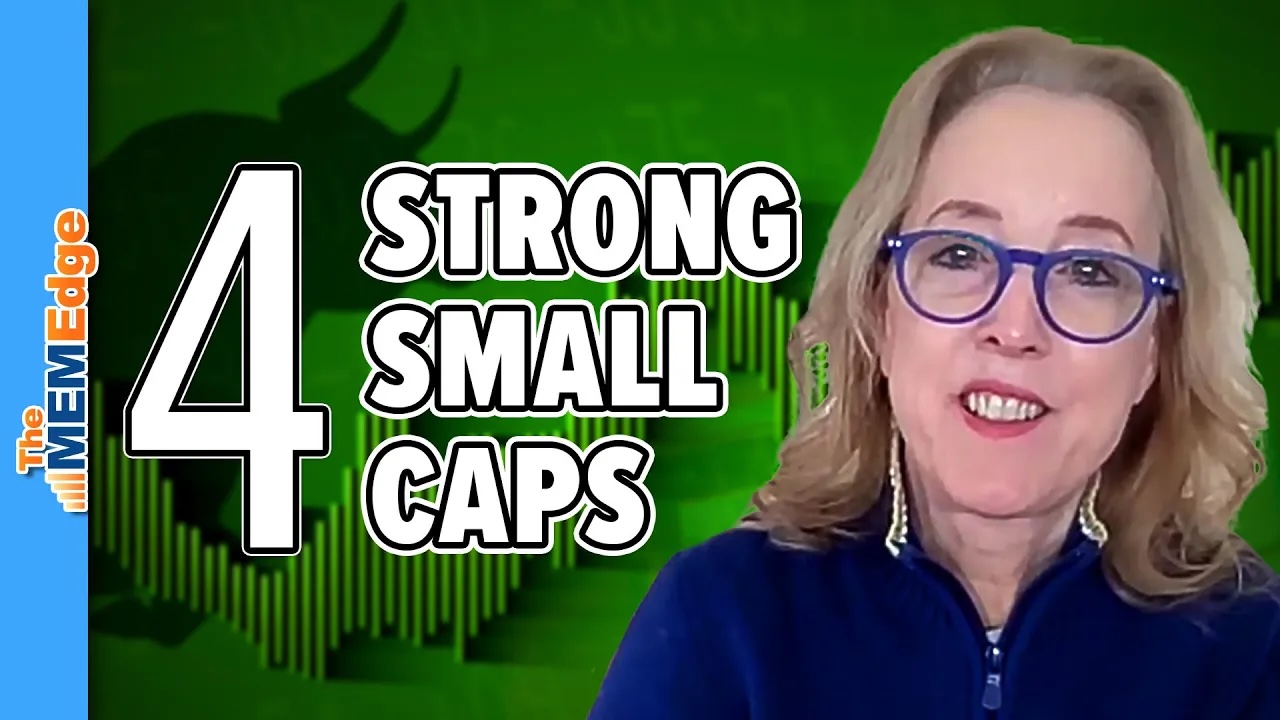
MEM TV: Small Cap STOCKS SHINE! 4 Names to Play the Strength
In this episode of StockCharts TV's The MEM Edge, Mary Ellen reviews what's shaping up in the broader markets after the Fed announced their rate cut plans. She also shares how to use ETFs to shape your investment decisions for the longer term Read More
The Mindful Investor3w ago

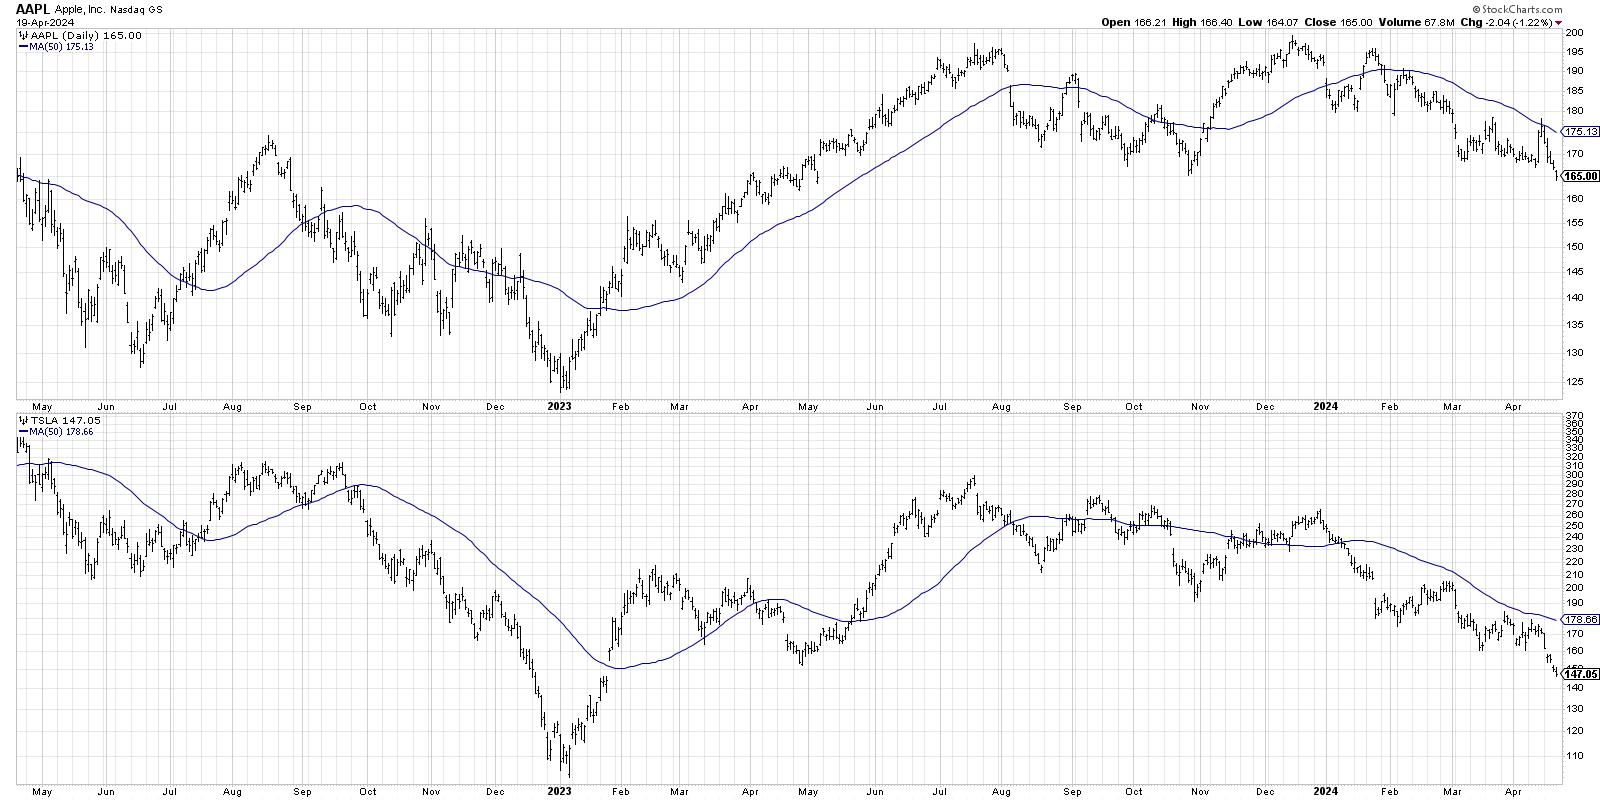
Which Magnificent 7 Stock Would You Pick for Q2?
This article represents an exercise I like to call the "Single Stock Portfolio". In this scenario, you can only own one stock in your portfolio for the next three months, and you can pick any one of the following eight stocks Read More
The Final Bar3w ago

Buy Breakout or Fade Divergence on Growth Stocks?
In this edition of StockCharts TV's The Final Bar, Dave presents a mailbag show discussing key technical analysis topics Read More
ChartWatchers3w ago
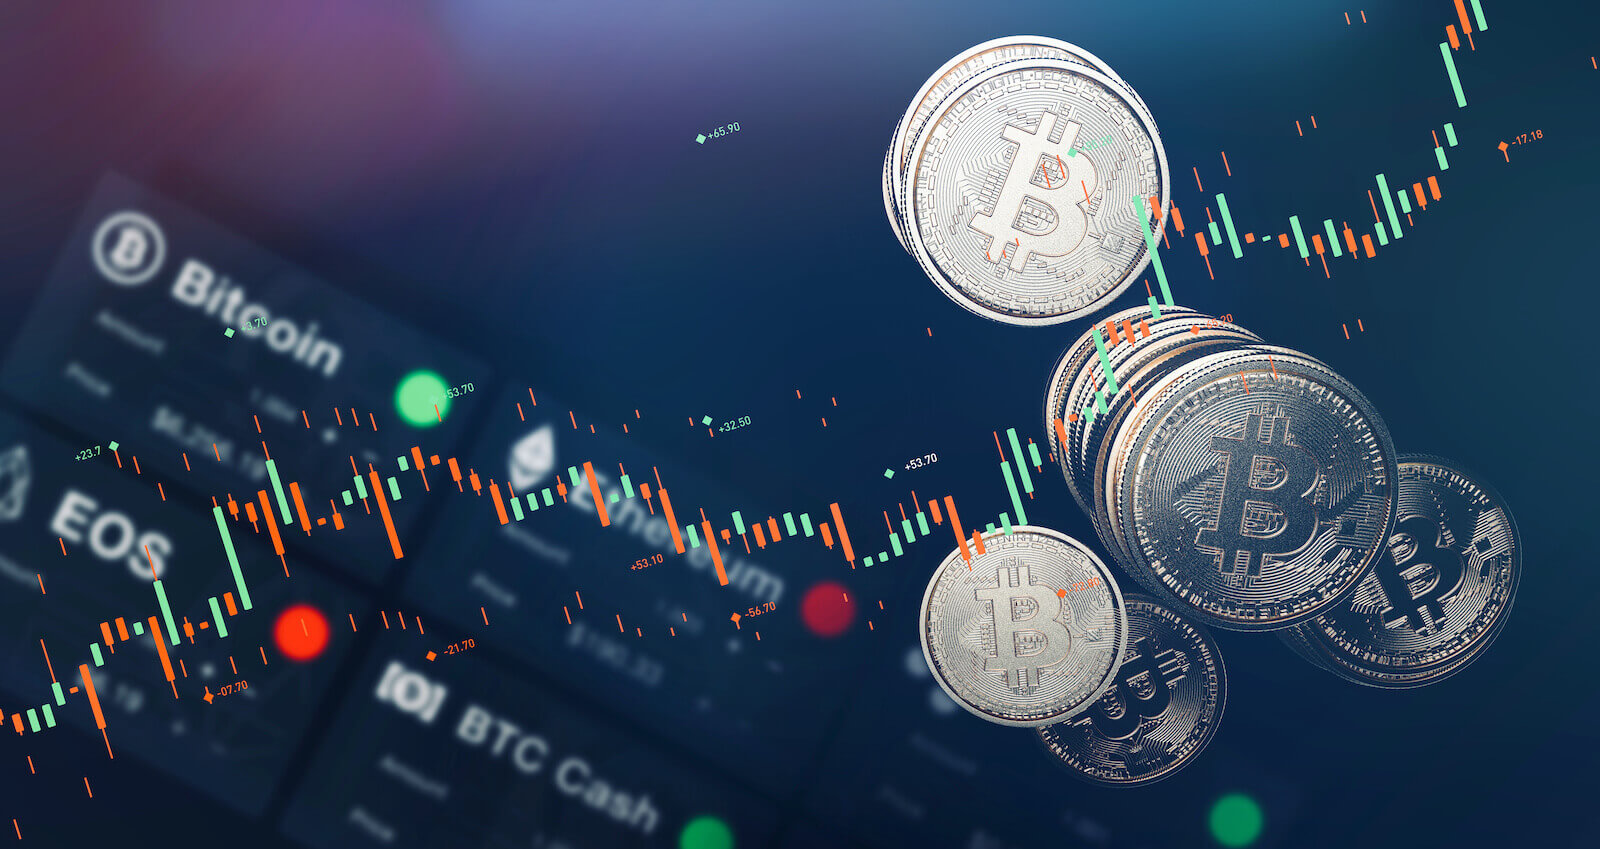
The Fourth Bitcoin Halving Is Upon Us: Is Now the Time to Go Long?
Bitcoin is about to undergo its fourth halving on April 19. For crypto enthusiasts, it's well known that this halving occurs every four years and is a critical event that can significantly alter Bitcoin's market dynamics as it affects the coin's supply mechanism Read More
Popular Articles
Breakdown in Mega-Cap Growth Confirms Bear Phase

S&P 500 Approaches 100-Day Moving Average: Is Now an Attractive Time to Buy Stocks?

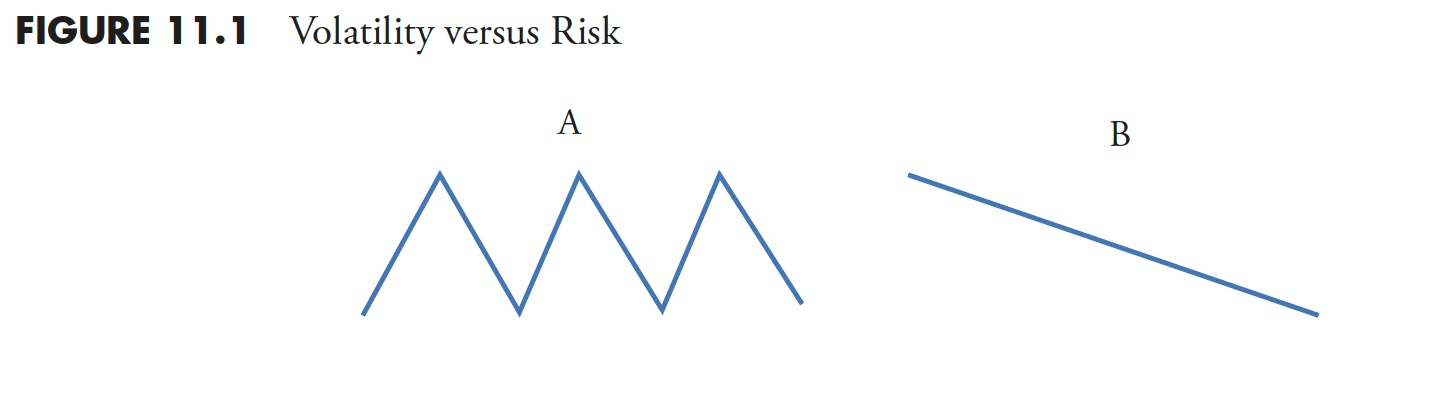
Getting Perspective and Dealing with Volatility
10% Downside Risk For Stocks as Value Takes The Lead
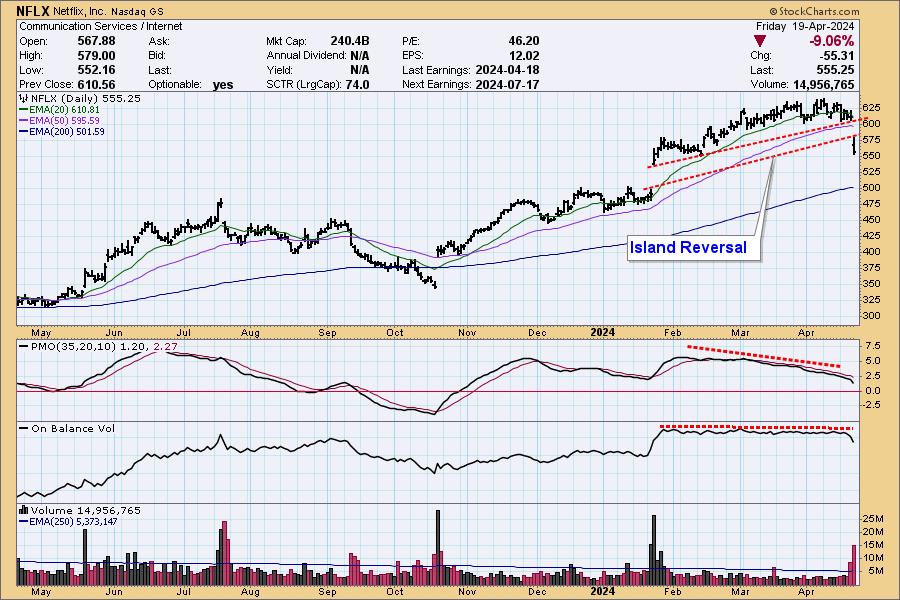
Netflix Gets Island Reversal On Earnings

META Stock in Limbo: What You Need to Know Before the Next Big Price Swing
Get expert technical commentary delivered straight to your inbox! Sign up for our FREE weekly ChartWatchers Newsletter. Learn More
Featured Authors


Featuring a diverse collection of books, DVDs and more, The StockCharts Store has everything you need to learn more about financial charting, improve your trading systems and become a better investor.
Public ChartList Leaders


StockCharts Members unlock complete access to the Stocks & Commodities Magazine archives. Read the latest articles or browse past editions.