Market Recap for Monday, October 31, 2016
The S&P 500 only finished down 0.26 points on the day Monday, but it felt a lot worse, mostly because that benchmark index finished very close to its low of the day and only 6 points from MAJOR short- to intermediate-term price support at 2120. But the bulls held off the bears for another day, primarily thanks to.........ummmmm, utilities (XLU, +2.00%)! Utilities were one of five sectors to finish in positive territory but, of the others, consumer staples (XLP, +0.25%) - another defensive group - was best. It was definitely a day for the utilities. What's interesting is that recent relative strength in the XLU is a primary reason that the benchmark S&P 500 continues to hang onto support. Check out this chart:
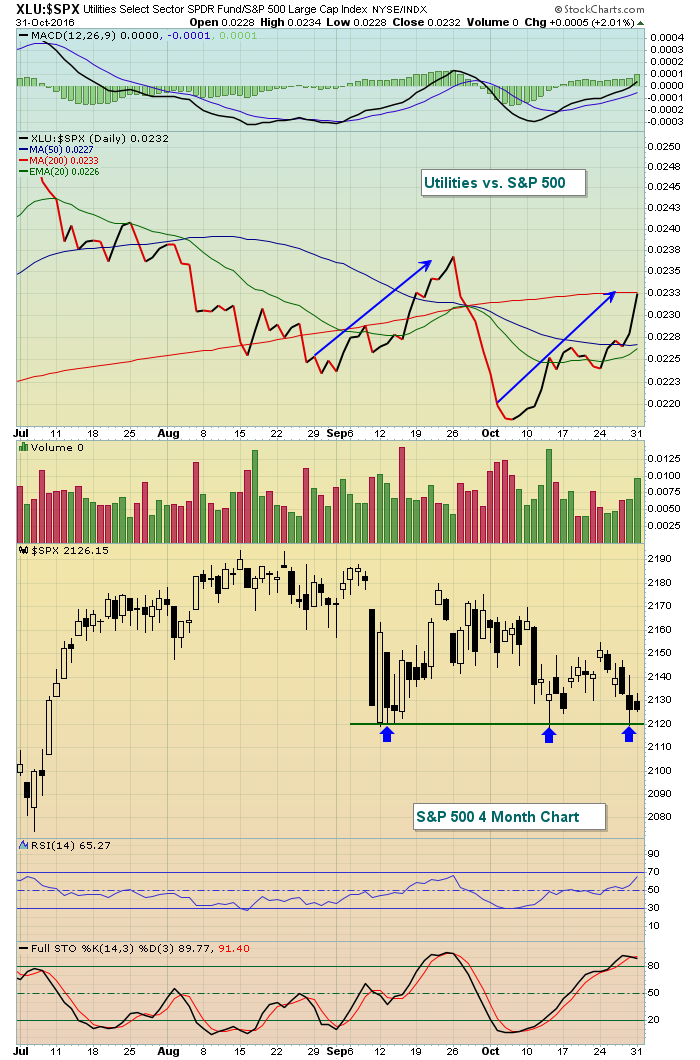 If you look closely at each test of 2120 support on the S&P 500, you'll see that the relative XLY:$SPX line is trending higher. In other words, it's the relative strength in utilities that's aiding the bulls in their attempt to hang onto price support. And while utilities are fighting to save the bulls, the four aggessive sectors - technology (XLK), financials (XLF), industrials (XLI) and consumer discretionary (XLY) - all remain in healthy technical patterns, at least for now.
Energy (XLE, -1.08%) was the weak link on Monday, but the drop has done little technically to warrant panic. In fact, it could be argued that the latest drop is nothing more than a pullback to test rising trendline support on both the XLE and on crude oil ($WTIC). Take a look:
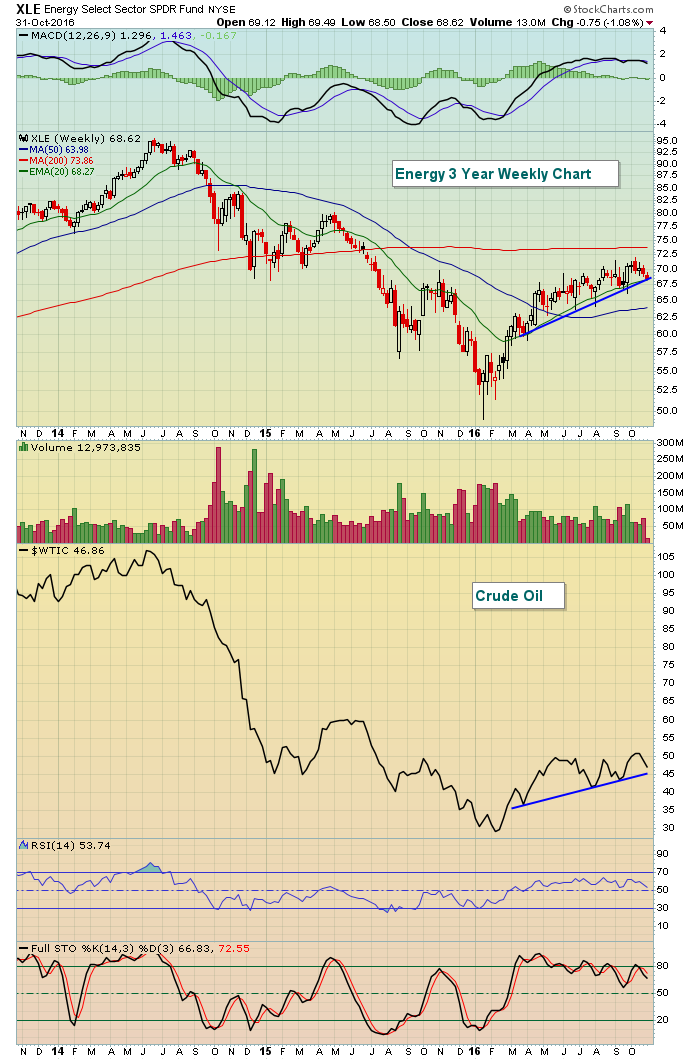 A break of trendline support on either or both would inflict much more technical damage, but until then, I'd be a buyer of energy.
Pre-Market Action
U.S. futures are higher this morning as market participants await the FOMC's policy decision, which will be announced at 2pm EST on Wednesday. The bond market appears to be pricing in another rate hike sooner rather than later so traders will be very interested in hearing the latest from the Fed. Also, we have the government nonfarm payrolls report due out on Friday at 8:30am EST. Both of these reports/announcements could have material impacts on both stocks and bonds.
Dow Jones futures are up 19 points at last check, following mixed global markets. Overnight in Asia, most markets finished higher - especially in Hong Kong as the Hang Seng Index ($HSI) closed higher by 213 points, or nearly 1%. That strength was fairly significant because the HSI had just closed at a two month low the session before. That should provide other markets a little relief.
Current Outlook
Volatility ($VIX) is once again becoming problematic as the S&P 500 hovers just above key price support. A rising VIX means higher expected volatility and that's exactly what drives stock prices lower. So we don't want to see the VIX move to a fresh high as the S&P 500 loses support. That's a recipe for quickly deteriorating prices and a rapid escalation in fear. Short-term stock traders should respect resistance in the VIX, especially if the S&P 500 falls beneath 2120 - even though we're in a historically bullish time of the year. If you recall, the 2007 top occurred on October 10th, just prior to the most bullish three month historical period for U.S. equities. History provides us a clue, not a guarantee. Here's the current look at the VIX and a key resistance level to watch:
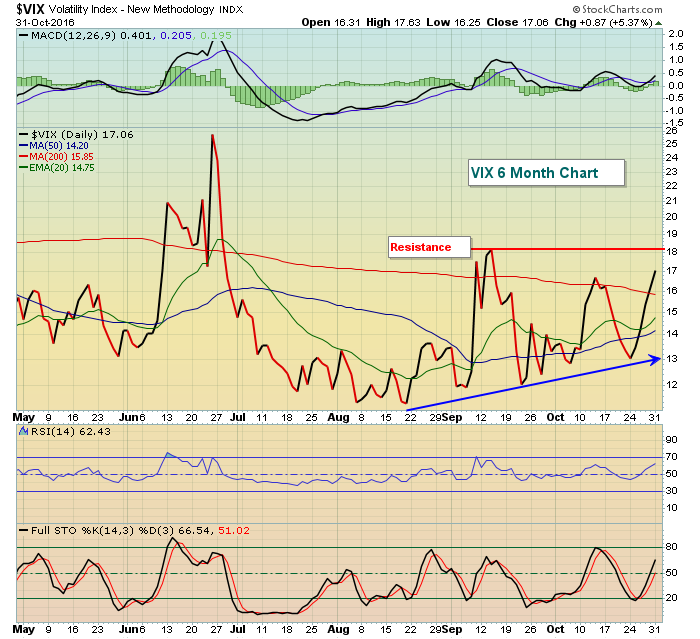 We know that the last two bear markets never saw the VIX decline below 16 once the bear market started. Currently, the VIX has moved up above that 16 level, but S&P 500 prices are holding, just like they did in recent months. But a price breakdown gives much more credence to the argument that we could be entering a bear market. That's why we need to respect a price breakdown accompanied by a soaring VIX.
Sector/Industry Watch
Energy (XLE) has struggled of late, although the Dow Jones U.S. Pipelines index ($DJUSPL) still remains an excellent relative performer vs. the S&P 500. I believe this absolute and relative weakness is an opportunity to move into or add long positions in the space. Here's the chart:
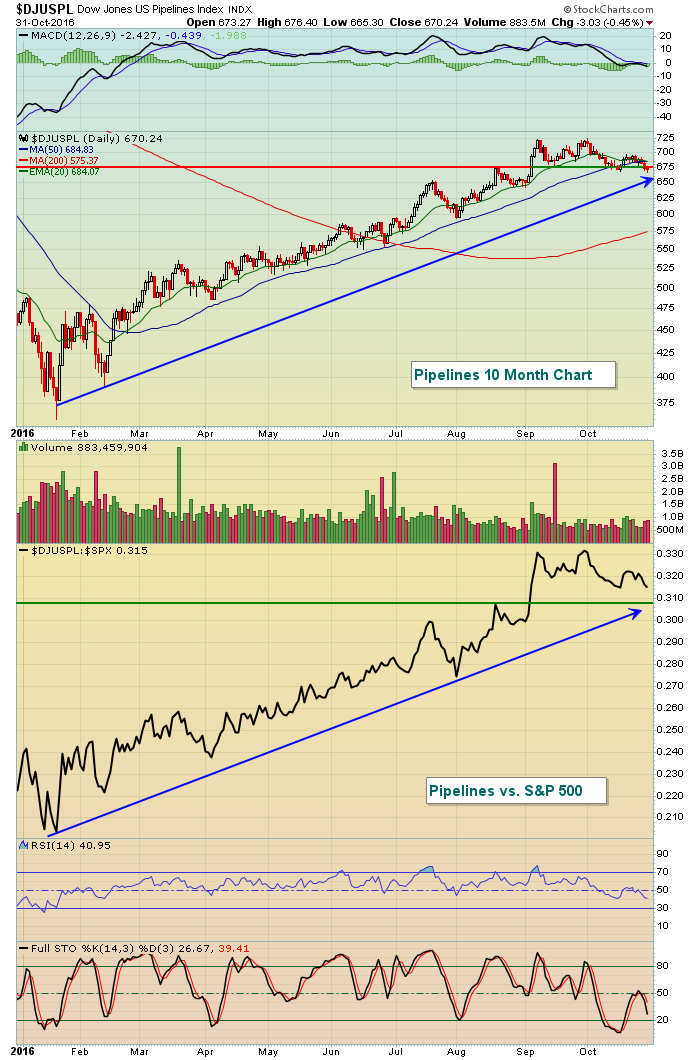 Bull markets are highlighted by rotation between sectors so finding sectors or industry groups shunned by market participants for a period of time while they pull back to test support levels generally represents a solid time to enter. I believe that's the case right now with the pipelines.
Historical Tendencies
The S&P 500 has risen in November 44 of the past 66 years and November has produced annualized returns of 17.84%, ranking it as the second best calendar month for the S&P 500 - trailing only December's 19.48%.
Key Earnings Reports
(actual vs. estimate):
ADM: .59 vs .47
BP: .30 vs .22
CMI: 2.02 vs 1.93
COH: .45 vs .44
DISCA: .40 vs .43
EMR: .96 vs .89
ETN: 1.15 vs 1.14
HRS: 1.39 vs 1.35
ICE: 3.21 vs 3.22
K: .96 vs .87
LYB: 2.31 vs 2.30
OXY: (.15) vs (.13)
PFE: .61 vs .62
PPL: .63 vs .59
RDS: .70 vs .54
SNE: .04 vs (.07)
TAP: 1.03 vs 1.00
TRI: .50 vs .48
(reports after close, estimate provided):
CERN: .56
DATA: (.35)
EA: .29
GILD: 2.74
ILMN: .87
SBAC: .10
Key Economic Reports
October ISM manufacturing to be released at 10:00am EST: 51.6 (estimate)
September construction spending to be released at 10:00am EST: +0.6% (estimate)
Happy trading!
Tom
