Market Recap for Thursday, November 3, 2016
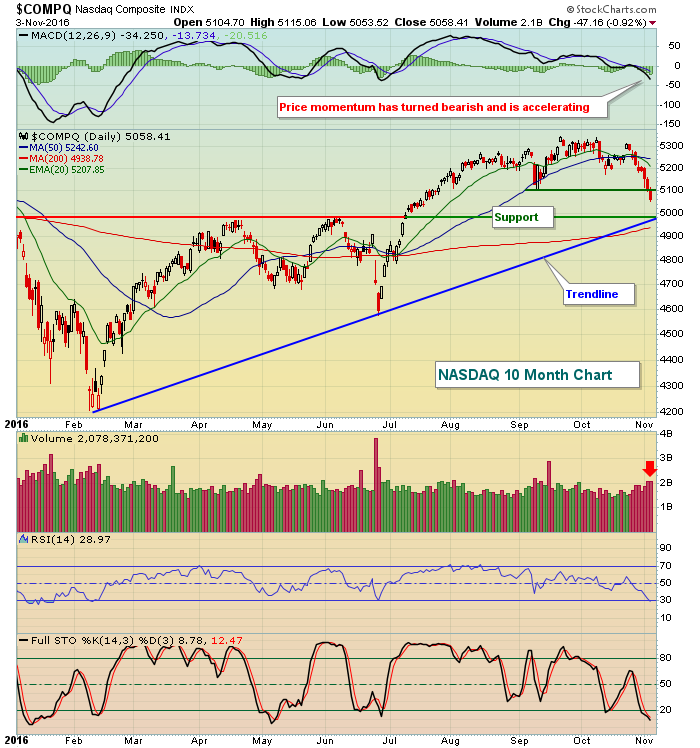
Outside of option expiration days, the NASDAQ's volume the past two days is the highest consecutive day volume level since the post-Brexit results in late June. And there are two further signs that suggest to me the selling hasn't ended and, in fact, could just be beginning. The first is the loss of price support on the NASDAQ to accompany the heavy volume. Check out yesterday's loss of 5100 price support:
The weakness on the NASDAQ was perpetuated by a very weak technology sector (XLK, -0.96%). The internet space ($DJUSNS) dropped 2.42% as giant Facebook (FB) warned of significantly slowing growth in 2017. The DJUSNS had been very strong and had not pulled back to test its breakout level of 1100. It seems to be on its way there now. Check this out:
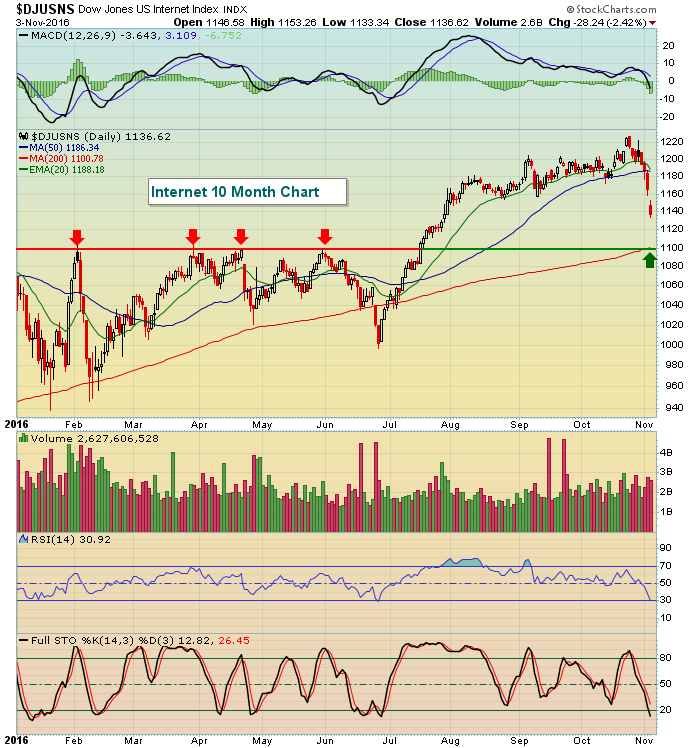 The selling certainly occurs much faster than the buying so be careful if you're trading stocks within this space. They appear to have further to run until support is hit.
Healthcare (XLV, -0.95%) also was a poor performer as biotech stocks ($DJUSBT) were weak.
Expected volatility ($VIX) is soaring as the VIX jumped another 14% on Thursday. The S&P 500 tends to tumble quickly with readings on the VIX above 20 so please be careful now that key support of 2120 has been lost and volatility is accelerating.
Pre-Market Action
Nonfarm payrolls were released 30 minutes ago and showed that jobs came up short of expectations. Wall Street was expecting 178,000, but instead 161,000 were reported. The reaction in the bond market is quite dull thus far, with the 10 year treasury yield ($TNX) falling just .6 of a basis point. The lower than expected jobs report would be expected to have a more dramatic impact with money flowing into treasuries and corresponding yields falling. It's early, however, so we'll see how the day unfolds.
U.S. equity futures are relatively flat, also with little reaction from the lower than expected jobs number. For now, the recent downtrend lives on.
Current Outlook
Now that the S&P 500 has broken down beneath a critical level of support at 2120, it makes sense to look for support areas where we might begin to see an oversold bounce. 2075 would be an initial price level that would make sense with 2000 a more intermediate-term price support level. Take a look:
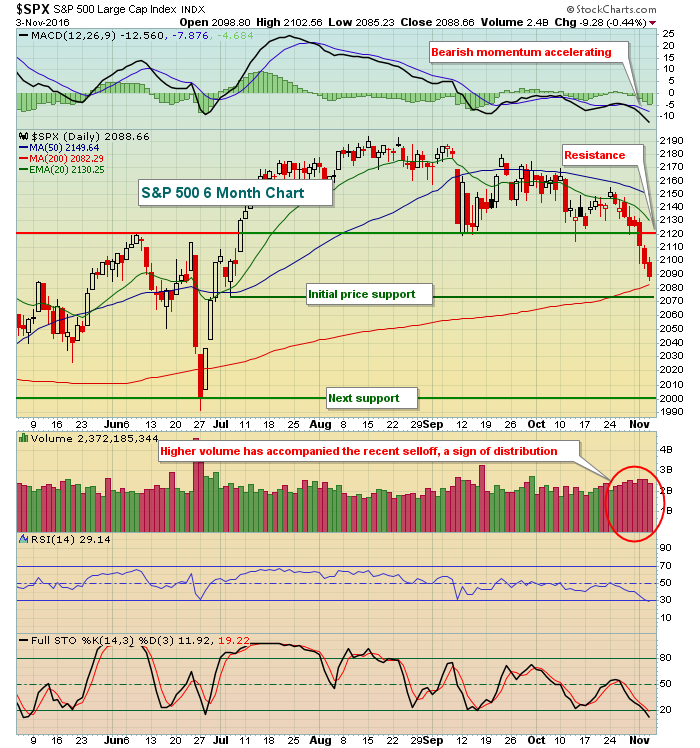 I didn't highlight it on the chart above, but the RSI and stochastic readings of 29 and 12, respectively, are oversold readings so a bounce could be expected at any time. If and when we see a bounce, look to price resistance at 2120 and the declining 20 day EMA (currently 2130) as likely rally-stoppers. A move through those levels would paint a more bullish picture once again, especially if the rally is accompanied by money rotating heavily towards aggressive sectors and areas of the market.
The breakdown below 2120, however, paints a much more bearish picture to me because of the warning signs I've spoken of many, many times over the past couple years. Outside of a typical oversold bounce, do not be surprised to see 2074 support tested in the near-term. If that level fails to hold, 2000 would be next.
Sector/Industry Watch
Life insurance ($DJUSIL) continues to perform very well in this rising treasury yield environment. While the S&P 500 lost ground for the 8th consecutive session, the DJUSIL threatened yet another breakout and remains above its key support level. Check out the strength in the DJUSIL since the 10 year treasury yield ($TNX) bottomed:
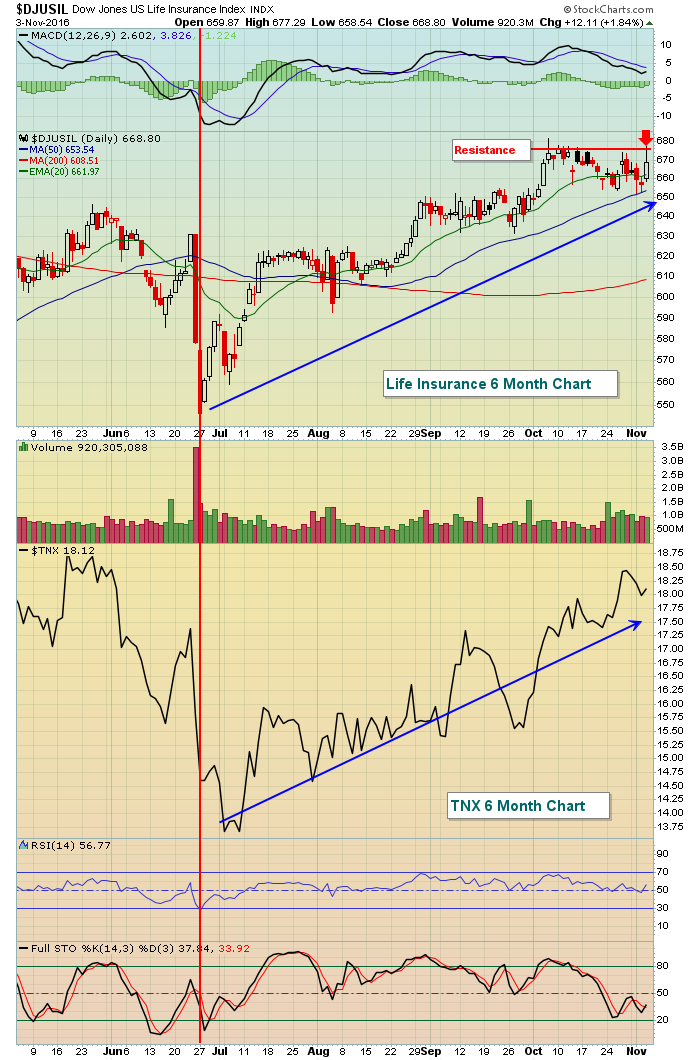 The red vertical line marks the bottom in the 10 year treasury yield ($TNX) and the DJUSIL bottomed shortly thereafter. Both have trended higher together for the past 4-5 months. So long as the uptrend in the TNX continues, I'd look for similar behavior from the DJUSIL.
Historical Tendencies
U.S. equities typically experience bullish behavior from the October 27th close to the November 5th close. This period has risen 46 of the last 65 years on the S&P 500. In 19 separate years, the S&P 500 has risen more than 3% during this 9 calendar day stretch. We've seen this period produce 5%+ returns 8 different years. On the flip side, the S&P 500 has fallen more than 3% during this period just twice and only time - in 1973 - has it fallen more than 5%.
This makes the current 8 day losing streak on the S&P 500 very unusual. Since the October 27th close, the S&P 500 has declined 2.10% ranking 2016 as the 5th worst October 27-November 5 period on record. The reaction to today's jobs report could lessen the pain or perhaps add to it as today marks the end of this bullish historical period.
Key Earnings Reports
(actual vs. estimate):
DUK: 1.68 vs 1.56
EXC: .91 vs .74
HUM: 3.18 vs 3.06
RBS: .10 vs (.20)
REGN: 2.41 vs 2.27
TU: .50 vs .51
XRAY: .66 vs .63
Key Economic Reports
October nonfarm payrolls released at 8:30am EST: 161,000 (actual) vs. 178,000 (estimate)
October private payrolls released at 8:30am EST: 142,000 (actual) vs. 170,000 (estimate)
October unemployment rate released at 8:30am EST: 4.9% (actual) vs. 4.9% (estimate)
October average hourly earnings released at 8:30am EST: +0.4% (actual) vs. +0.3% (estimate)
Happy trading!
Tom
