Market Recap for April 25, 2016
Energy (XLE) was very weak on Monday, losing 1.12% to finish 9th out of 9 sectors. Technically, the sector is still very strong and has essentially "reset" its hourly MACD to centerline support. A negative divergence on the hourly chart suggested the XLE could use a little time to gather itself before another attempt to push higher. Now we'll see if that's the case. Here's the intraday hourly chart:
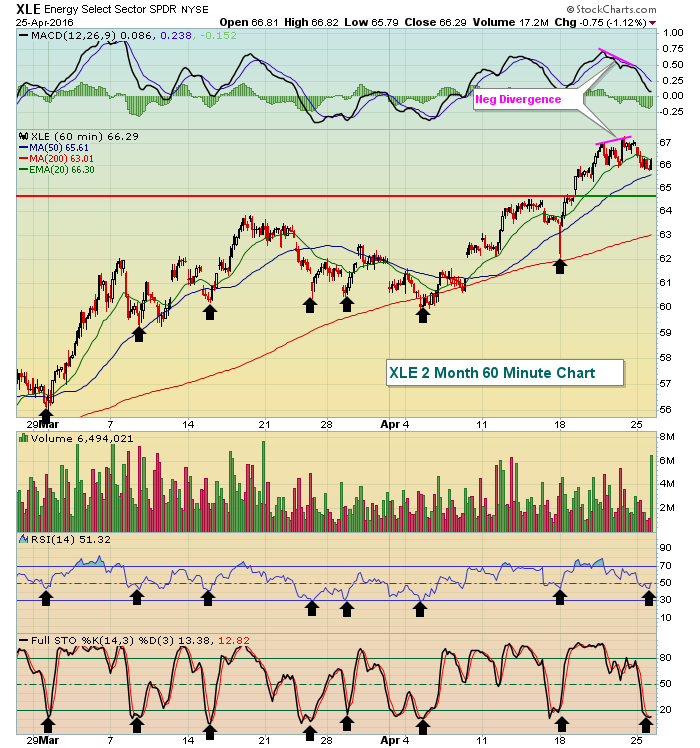 The black arrows mark short-term oversold conditions with stochastic dropping below 20 while at the same time RSI hits either 30 or 40. Currently, stochastic and RSI reside at 13 and 51, respectively. If the XLE drops back to test price support near 65, we'll likely see the RSI once again reach oversold territory, prompting a response by the bulls.
Crude oil ($WTIC) dropped 1.74% on Monday as it attempts to clear its declining 50 week SMA for the first time since the summer of 2014. A bit more strength would also likely send the weekly MACD above centerline resistance for the first time in nearly two years. Check out this longer-term view of crude oil:
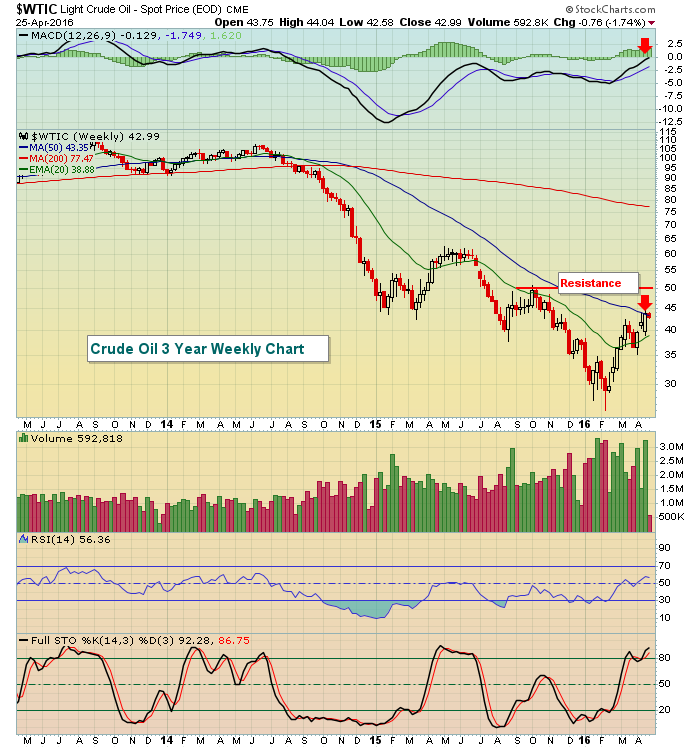 Should the WTIC clear its 50 day SMA resistance, the next stop would probably be $50 per barrel where crude oil topped in October 2015.
While energy was weak on Monday, consumer staples (XLP) was the relative leader, gaining .69%. The XLP was led by food retailers & wholesalers ($DJUSFD), which I'm featuring today in the Sector/Industry Watch section below.
Pre-Market Action
March durable goods were weaker than expected, rising just half of the anticipated +1.6%. This latest economic news comes as the FOMC kicks off its latest two day meeting, culminating in an interest rate announcement scheduled for 2pm EST on Wednesday. The treasury market doesn't seem to be bothered by the durable goods shortfall as the 10 year treasury yield ($TNX) has risen to 1.92% this morning. It's interesting that the TNX has gravitated to the 1.90%-2.00% area as bond traders look to the Fed for further direction in monetary policy.
U.S. futures are up slightly.
Overnight, Asian markets were mixed with the Nikkei ($NIKK) down roughly 0.5% while both the Shanghai Composite ($SSEC) and Hang Seng ($HSI) gained fractionally. In Europe, the major indices are straddling the flat line. It's hard to tell how the day will turn out, but with the Fed in the background, global markets appear to be setting up for a rather dull day.
Current Outlook
Looking at a 60 minute chart, the S&P 500 remained in a short-term downtrend into Monday's close, but had not lost short-term price support. That's important because there's a negative divergence on the daily chart. Loss of price support would likely result in accelerated selling. At the close on Monday, the S&P 500 closed almost squarely on its declining 20 hour EMA. Futures are pointing higher this morning and if that holds true into the open, the S&P 500 should open above its 20 hour EMA, a short-term positive. Take a look at the hourly technicals:
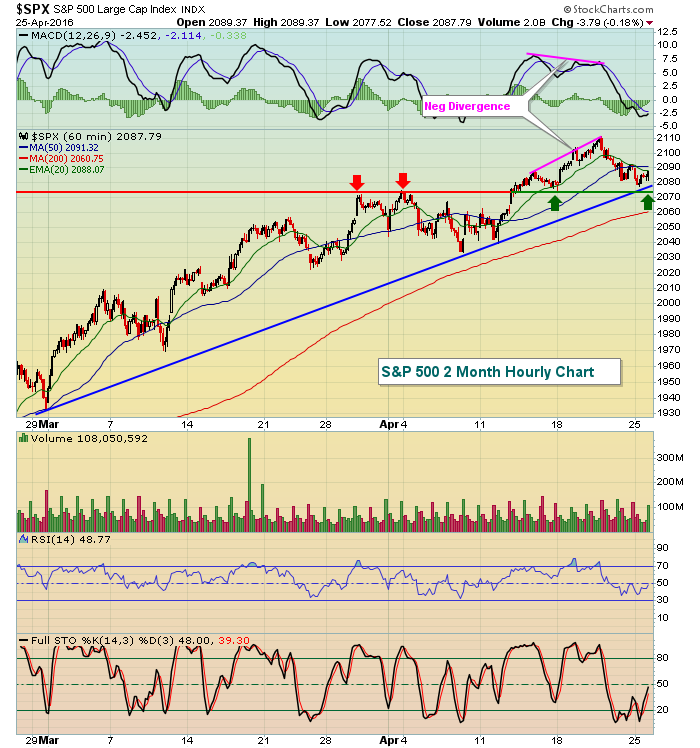 Should the S&P 500 lose support just above 2070, don't be surprised to see a quick trip down to the 2030-2040 area to test the lows set back earlier in April.
Sector/Industry Watch
On Monday, the Dow Jones U.S. Food Retailers & Wholesalers Index ($DJUSFD) printed a reversing bullish engulfing candle off its recent downtrend. While that's a short-term bullish signal, the group is in the midst of a bullish ascending triangle continuation pattern on its longer-term chart. Check this out:
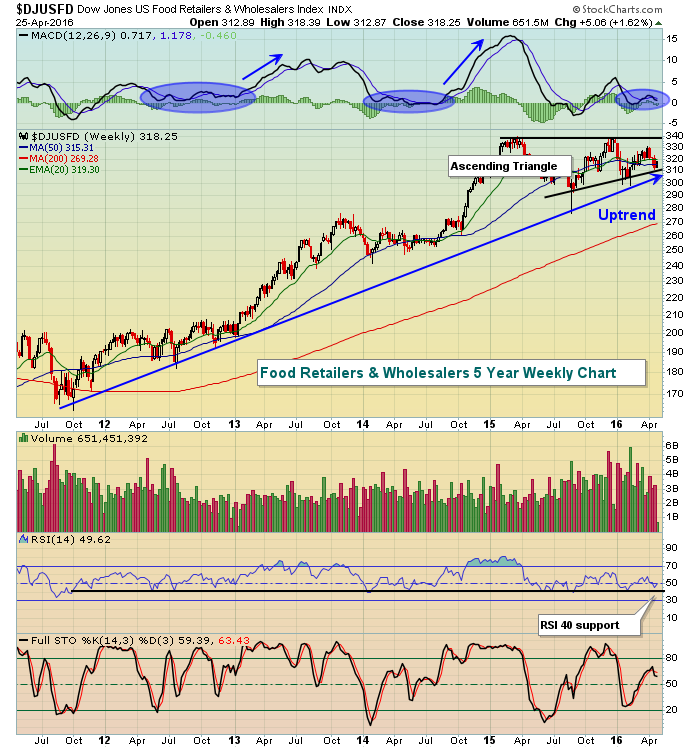 The blue shaded areas show the MACD remaining near the centerline during periods of consolidation just prior to pronounced breakouts. A close above 340 would likely trigger the next move higher.
Historical Tendencies
The Russell 2000 still has to survive the next two days where historically it's produced annualized losses of 9.70% and 52.61%. But the April 28th to May 5th period has been particularly kind to small cap bulls with annualized returns of 49.62%. Since 1987, the Russell 2000 has moved higher 104 days during this period while moving lower just 56 days.
Key Earnings Reports
(actual vs. estimate):
BAX: .36 vs .29
BP: .17 vs (.30)
COH: .44 vs .41
DD: 1.26 vs 1.02
FCX: (.16) vs (.20)
GLW: .28 vs .28
HSY: 1.10 vs 1.05
IR: .50 vs .37
JBLU: .59 vs .53
LLY: .83 vs .85
LMT: 2.58 vs 2.51
MMM: 2.05 vs 1.92
PG: .86 vs .81
RAI: .50 vs .50
TMUS: .56 vs .17
(reports after close, estimate provided):
AAPL: 1.97
AFL: 1.62
AIZ: 1.30
BWLD: 1.77
CMG: (1.06)
COF: 1.90
EBAY: .39
EW: .66
KLAC: 1.00
PNRA: 1.50
PSA: 2.20
T: .69
TWTR: (.13)
X: (1.29)
Key Economic Reports
March durable goods released at 8:30am EST: +0.8% (actual) vs. +1.6% (estimate)
March durable goods ex-transports released at 8:30am EST: -0.2% (actual) vs. +0.5% (estimate)
February Case-Shiller HPI to be released at 9:00am EST: +0.7% (estimate)
April consumer confidence to be released at 10:00am EST: 96.0 (estimate)
Happy trading!
Tom
