Technology stocks have been lagging throughout 2015. One of the primary reasons for their uninspiring performance has been the underwhelming action in the Dow Jones US Semiconductor Index ($DJUSSC). Before we delve into the semiconductors, let's see what technology as a whole is facing - take a look at this two year weekly chart on the XLK (ETF tracking the technology sector):
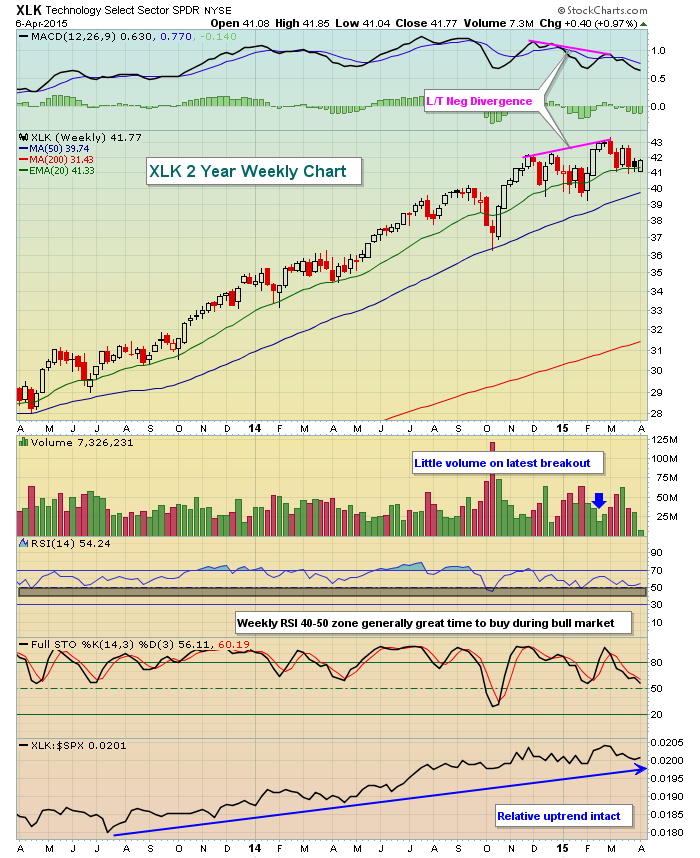
There is a lot to discuss here. Perhaps the first piece of technical news to note is that the XLK relative to the S&P 500 has been a very strong performer. The relative uptrend line remains perfectly intact despite the group lagging since the end of February. That's important because it tells me that, if anything, I want to remain on the long side of the group when I trade. The second bullish feature here is that the weekly RSI, overbought during much of this two year period, is in the 50s and not far from that key 40-50 zone where we see many intermediate-term bottoms form in an uptrend. So further weakness could set up excellent reward to risk trading candidates within technology in general. Unfortunately, that's where the bullishness ends. There's a long-term negative divergence in play on the weekly MACD and that sometimes can lead to weeks and weeks of frustration. Those of you trading technology stocks over the past 5-6 weeks would probably agree. I would not be surprised to see the frustrating action continue in the near-term to let that MACD unwind back close to centerline support. The February breakout and high were quite ominous not only because of the negative divergence, but also because of the lack of volume to accompany the breakout. It seemed to suggest there simply wasn't enough interest in the group to carry it any further - at least not for now.
With that backdrop, we turn our attention to semiconductors. Over the last twelve months, technology has been one of the best performing sectors and semiconductors have been one of the strongest industry groups within technology. But we know that money rotates during bull markets. The same sector and the same industry group doesn't lead every day, every week or every month. The best of the best fall out of favor temporarily. It's encouraging to see that the relative uptrend in the XLK vs. the S&P 500 is still in play. So how do the volatile semiconductors look? Well, first let's check out that longer-term two year chart:
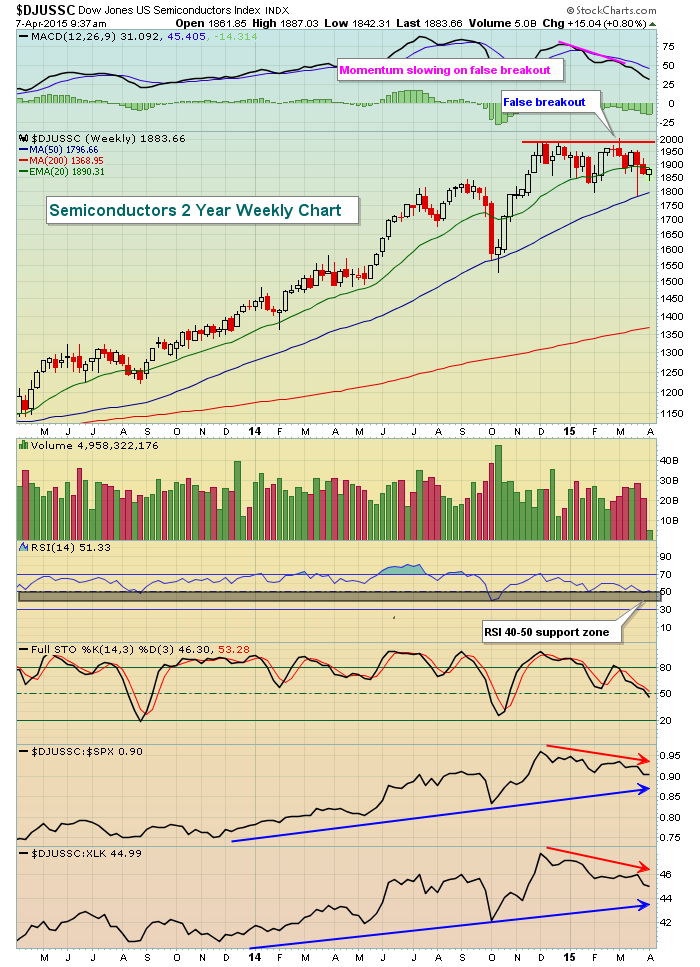
Just a little more than one month ago, semiconductors looked great in terms of price action alone. They were breaking out once again in what's been a parabolic move to the upside. What's not to like? Well, a few things. While the DJUSSC was making another breakout, note that its relative strength vs. the S&P 500 was weakening as was its relative strength vs. its own peers in technology. The red arrows at the bottom of the chart reflect this. In fact, the relative weakness began back in December. Weekly RSI also hit overbought territory at 70 in early December, then we saw the false breakout in February on declining volume. The picture wasn't so bright after all. The good news, though, is that the DJUSSC remains in a long-term uptrend in both price and relative performance. For now, it's consolidating in sideways fashion between 1800-2000. Further consolidation would likely send the weekly RSI below 50, which would really begin to make this industry group attractive on a reward to risk basis because if the current bull market continues, it's hard to imagine the semiconductors not kicking it back into gear and participating. They appear poised to begin leading again on a relative basis sooner rather than later. Here's the close up daily view of the DJUSSC:
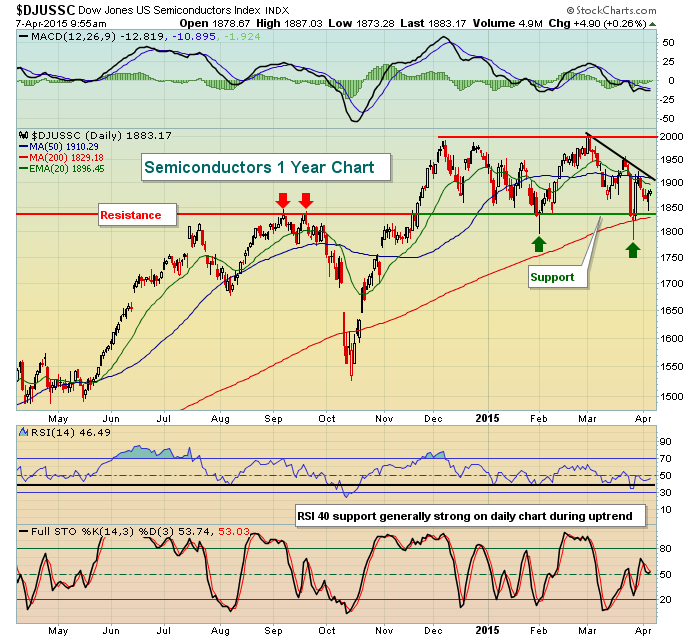
Technical Analysis 101 tells us that broken price resistance become price support. The red/green line clearly identifies this level. Early February and late March showed the bears twice trying to take this group below price support, only to fail each time. So while solid price resistance formed near 2000, we've also seen solid price support hold near 1800 despite two intraday lows beneath it. Daily RSI is now back in the 40s and the daily MACD is now positioned just beneath centerline support. Failure to hold onto price support at 1800 on a closing basis could definitely lead to more short-term technical selling, but I wouldn't assume that support level is going to break. Remember, the trend here over the long-term is HIGHER so we should be anticipating that trend to continue and looking for a key reversal to trigger the next leg higher. The DJUSSC has been trending lower off that early March high. I'd be watching two areas for possible entry into semiconductors. Another failed breakdown with a reversing candle would represent solid entry into this space. Also, a breakout above that 5-6 week downtrend (black) line would send a bullish signal as well. In the meantime, semiconductors remain a relative laggard as the downtrend line and price support squeeze this influential group into a narrower and narrower space.
I'm not ready to throw the towel in on this bull market so my take is that after this consolidation period ends, semiconductors will resume a leadership role and we'll see solid returns from the DJUSSC on both an absolute and relative basis.
Happy trading!
Tom
