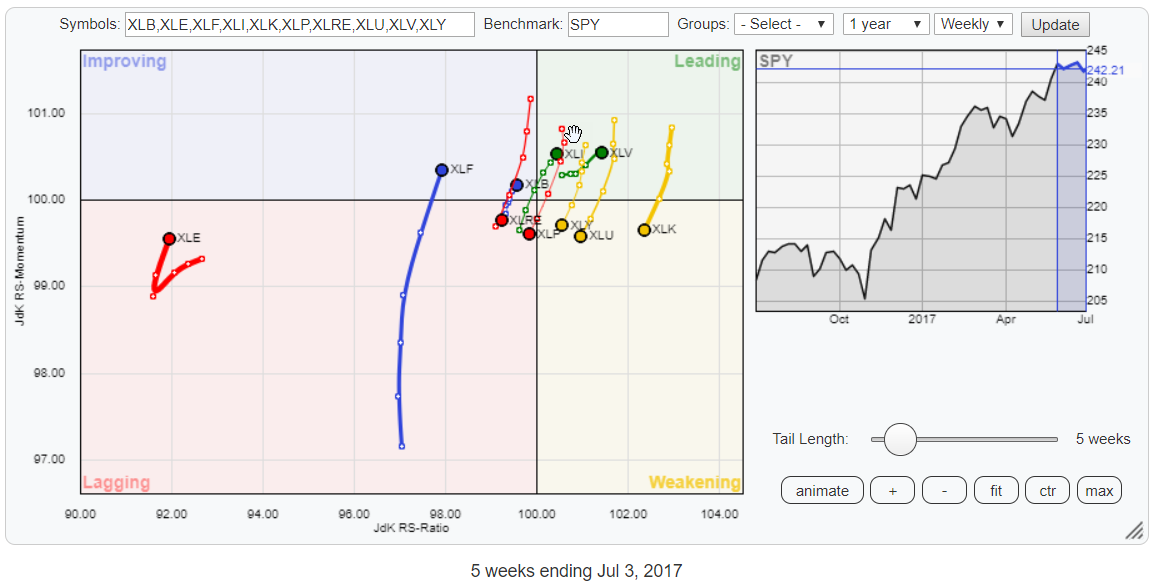
 The almost vertical tails on the above Relative Rotation Graph for US sectors indicates a very clear (relative) momentum rotation, sending some sectors from North to South and vice versa.
The two most obvious tails on the RRG are for XLE, far away on the left while sharply hooking upward, and XLF which has the longest tail in the universe at the moment, indicating that a strong (momentum) move/rotation is underway.
Summary
- Vertical tails on RRG indicate strong (relative) momentum based moves
- XLK and XLE wide apart on either side of the RRG suggesting strong relative (up- and down-) trends
- Staples heading for further relative rotation into lagging
- All eyes back on financials (XLF) for good reasons. Further rally expected when resistance near $ 25 can be taken out.
- XLI (Industrials) potentially most promising sector in S&P at the moment.
Zooming in
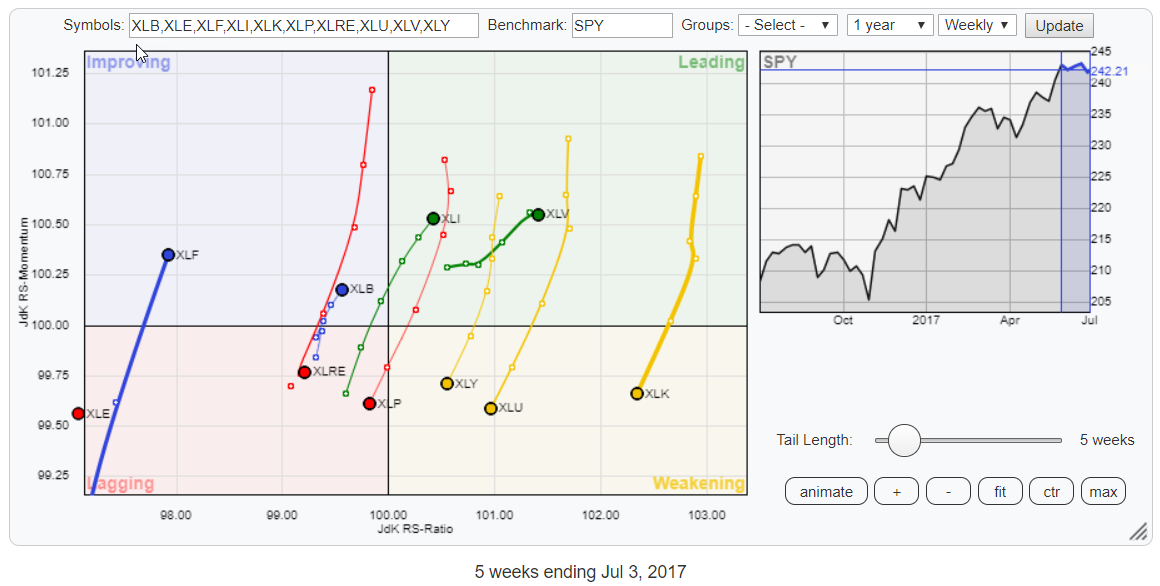 When we isolate the XLE and XLF moves and zoom in on the other eight sectors on the RRG, we can see how strongly opposite some of the sectors in the S&P 500 universe are moving.
Inside the weakening quadrant, we find XLK, XLU, and XLY, all three showing an almost vertical tail pointing lower. This is also the case for XLRE and XLP inside the lagging quadrant. All five tails for these sectors heading South are more or less similar in length.
Apart from XLF, we also find XLB inside the improving quadrant. This Materials sector, however, has a much shorter tail than XLF suggesting that there is a lot less power behind that rotation.
Inside the leading quadrant, we find XLI and XLV. Both at a North-East RRG-Heading but Industrials (XLI) showing the longer (=stronger) tail suggesting more potential.
Technology Select Sector SPDR Fund - XLK
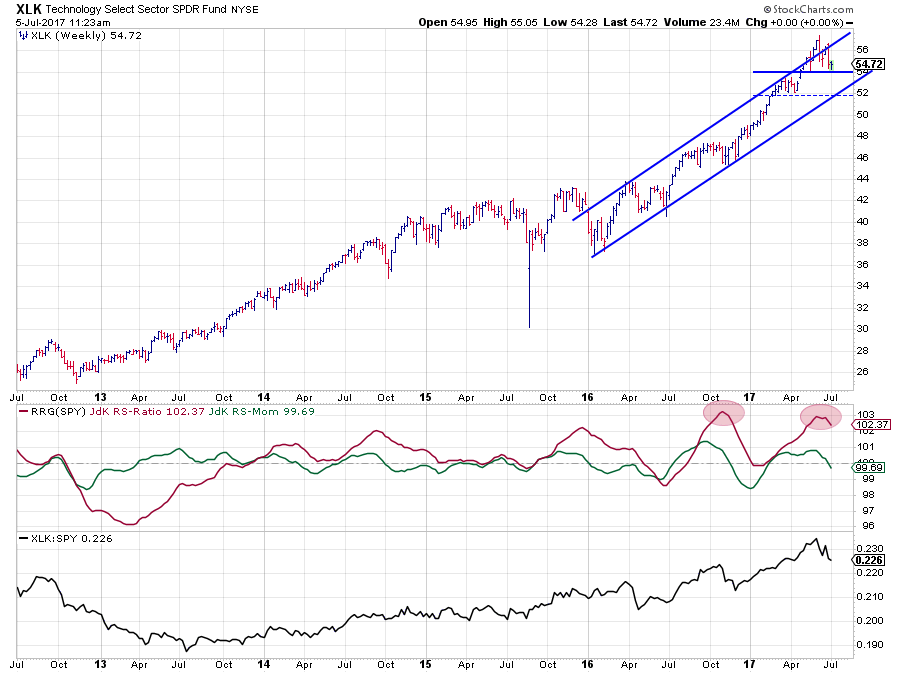
Technology is, still, the sector with the highest reading on the JdK RS-Ratio scale, meaning that the relative uptrend is intact but losing relative momentum at the moment. Whether this loss of momentum is the start of a rotation towards and into the lagging quadrant and thus a relative downtrend against SPY is too early to tell.
Based on both the price- and the relative charts above the current weakness can very well be a temporary setback, resulting in a rotation on the right-hand side of the RRG, similar to the rotation we saw during Q4-2016.
This is based on the observation that the RS-Line is still following a pattern of higher highs and higher lows and the RS-Ratio line being at peak levels, similar to those at the end of 2016.
On the price chart XLK just returned within the boundaries of the rising channel after a brief upward break. Frequently this results, at the minimum, in a test of the lower boundary of that channel. A break of $ 54 will probably trigger a further decline towards that lower boundary that currently lies around $ 52.
For current holdings in technology, I'd say it is too early to sell unless you're very aggressive but definitely premature to buy for a potential new leg up.
Energy Select Sector SPDR - XLE
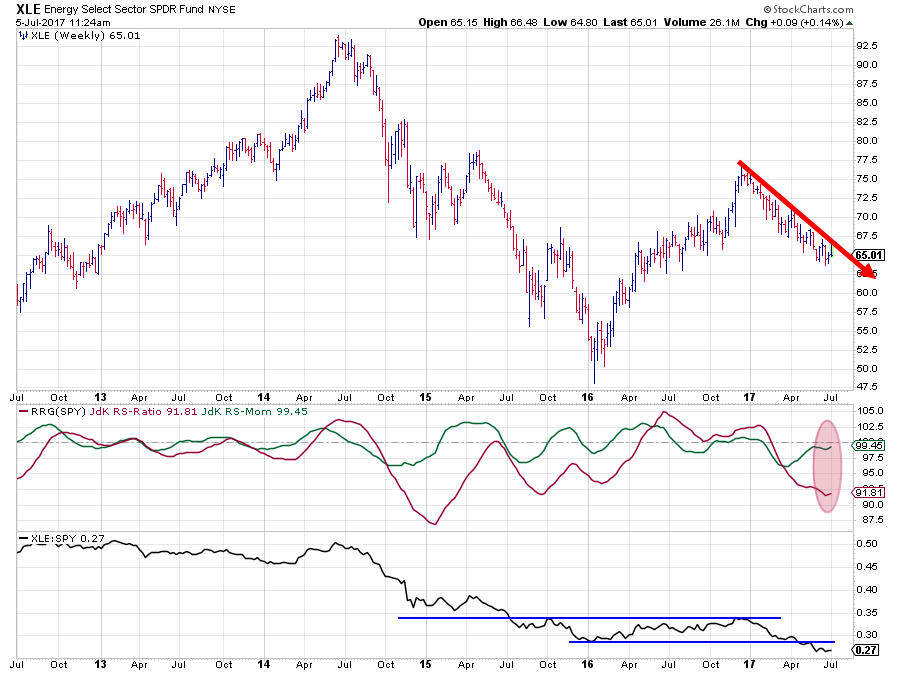
Opposite technology, at the far left side of the Relative Rotation Graph, is Energy (XLE).
Year to date XLE is in a defined and narrow channel moving lower. On the RS-Line also a steady move lower is visible. In April the RS-Line broke below its previous low from early 2016, confirming the relative weakness for this sector.
The rising JdK RS-Momentum line since April is the result of a slower pace of the decline. It caused the steepness of the decline to level off a bit, but RS-Ratio is still moving lower.
Give the low level of RS-Ratio and the weak price chart the odds are high for a rotation on the left-hand side of the RRG which means that XLE may crossover into improving in coming weeks but then returns to lagging after the recovery in RS is over.
The current position on the RRG still justifies underweight positions for Energy stocks in a portfolio.
Consumer Staples Select Sector SPDR - XLP
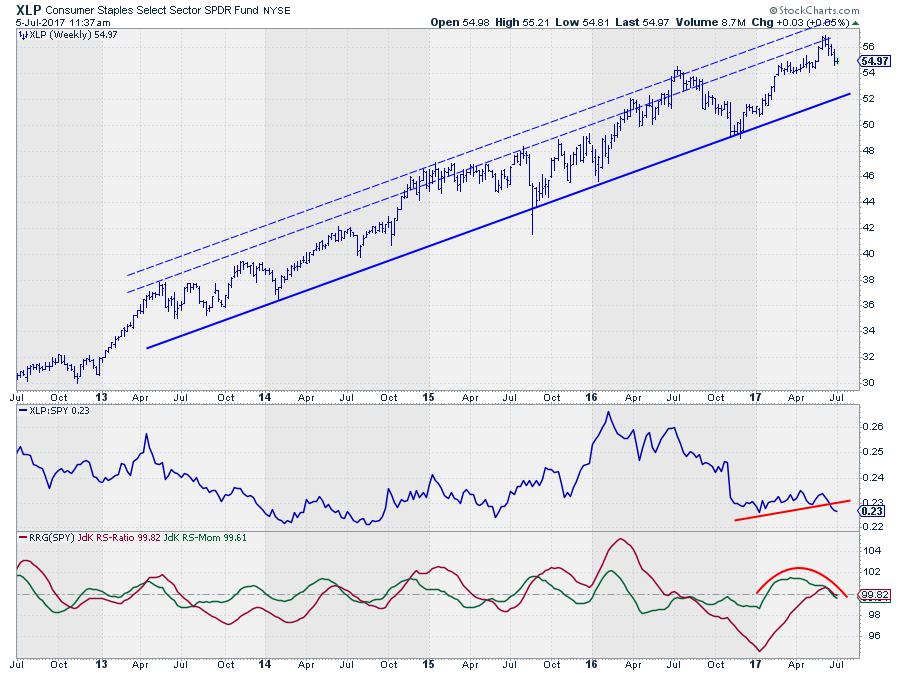
The price chart for the Consumer Staples sector is still fantastic. A very regular series of higher highs followed by higher lows and contained within the boundaries of a rising channel.
The relative picture is less enticing.
The raw RS-Line peaked back in early 2016 and has been moving lower since. At the beginning of this year, XLP set a low in relative strength out of which is moved gradually higher, but the recovery was only mild.
Very recently the sector crossed over into the leading quadrant, but at that time the JdK RS-Momentum line had already started to decline again.
Last week's break below support in relative strength pushes both RRG-Lines below 100 again and sends XLP into the lagging quadrant at a strongly negative RRG-Heading.
All in all more than enough reasons to avoid Staples stocks for the time being.
Financial Sector SPDR Fund - XLF
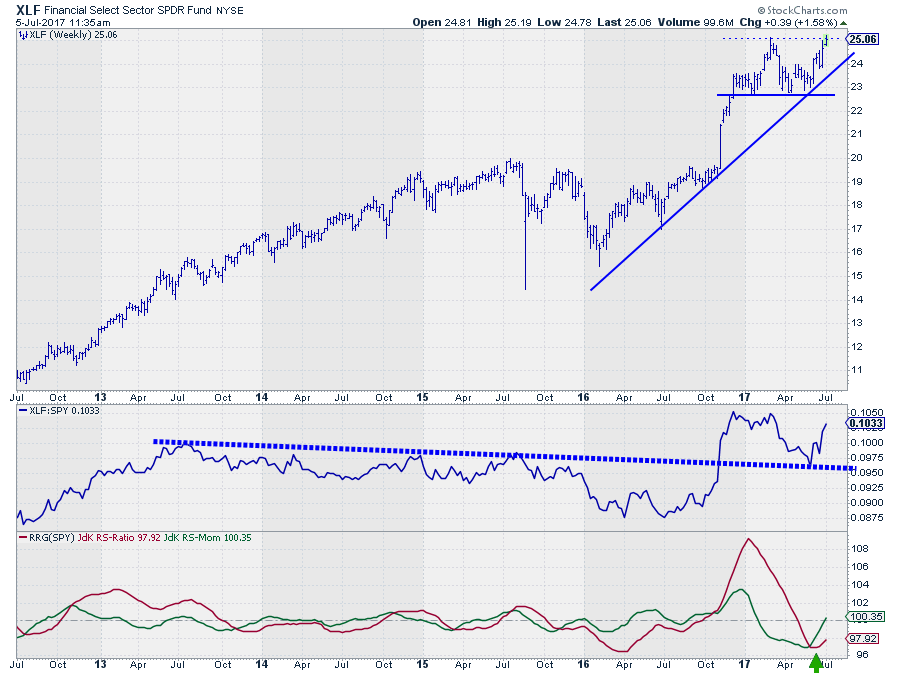
All eyes on Financials! After a steep drop in relative strength and a rotation into the lagging quadrant on the Relative Rotation Graph XLF is back on the radar for many people.
The price graph shows an interesting pattern. After a steep rise towards the end of 2016, XLF seemed to be tracing out a small H&S reversal pattern during the first six months of this year.
However, instead of breaking the neckline, and the rising support line which came together at that time, downward and accelerating lower this double support level proved to be strong enough to catch the decline and send financial stocks higher again.
At the moment XLF is challenging resistance offered by its previous peak near $ 25. A break beyond this level will very likely trigger a further acceleration in price for XLF and push the rotation further into the weakening quadrant and potentially further into leading.
Being and remaining underweight financials in a portfolio does not seem like a good idea anymore.
Industrial Select Sector SPDR Fund
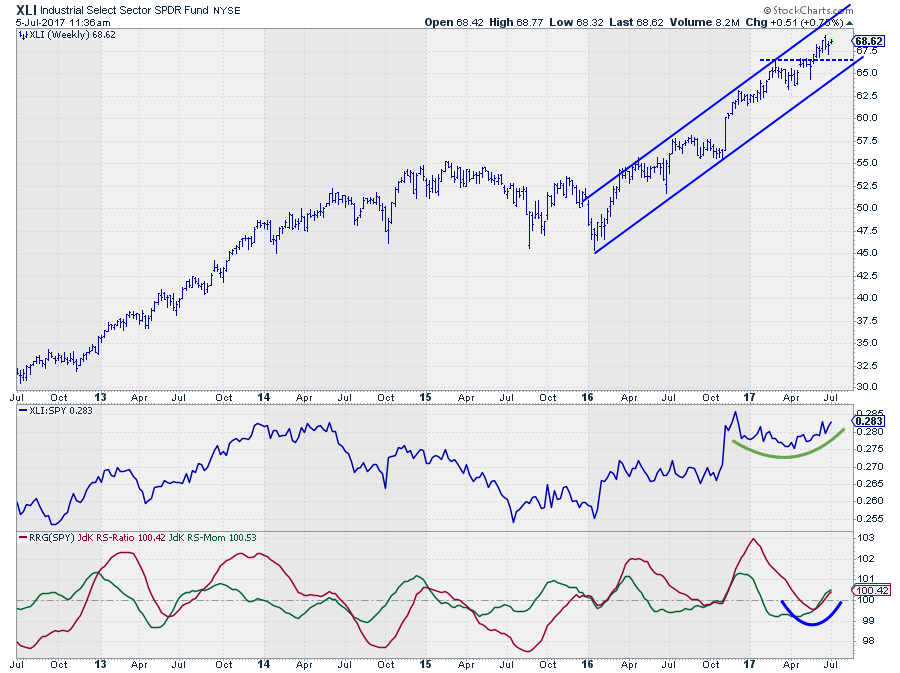
One of my previous blogs at the beginning of June looked at the individual stocks in the Industrials sector (XLI) including a brief peek at a sector level.
The improvement that was noted then continued for the month of June and into July and things only look to improve further at the moment.
The rising channel on the price chart is fully intact, and XLI just cleared resistance coming off the previous peak which may now be expected to act as support in case of a correction.
The relative strength line is starting to build up momentum now and is tracing out a higher low and looks ready to take on the prior relative high (late 2016). I'm keeping an eye on that level as a break higher will very likely be the catalyst for further relative improvement and push XLI even deeper into the leading quadrant.
The current position on the Relative Rotation Graph in combination with the RRG-Heading make XLI one of the more promising sectors in the S&P 500.
Julius de Kempenaer | RRG Research
RRG, Relative Rotation Graphs, JdK RS-Ratio, and JdK RS-Momentum are registered TradeMarks by RRG Research
Follow RRG Research on social media:
If you want to discuss RRG with me on SCAN, please use my handle Julius_RRG so I will get a notification