With the recent crash of the SPDR S&P Regional Banking ETF (KRE), you may wonder if there were adequate technical warnings ahead of the crash. Yes, there were. (To clarify, we're looking for reasons not to be long KRE.)
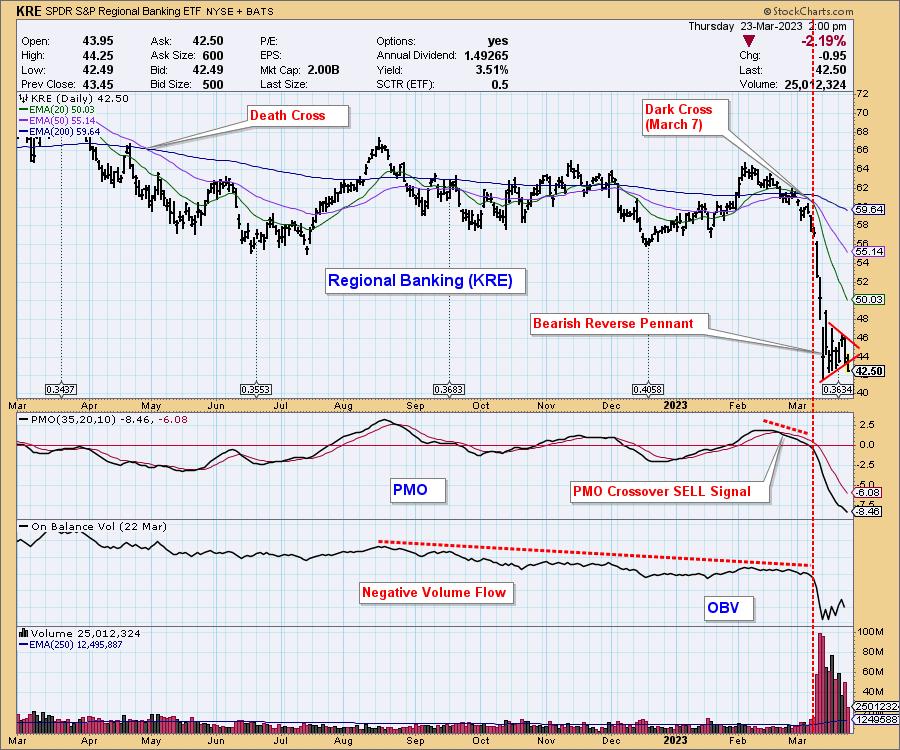
- To begin, last April, the KRE 50-day exponential moving average (EMA) crossed down through the 200-day EMA (a Death Cross), giving an LT Trend Model SELL Signal. We view mechanical signals as information flags, not action commands, so this informed us that the long-term technical picture had turned negative. This never changed.
- The 20-day EMA crossed down through the 50-day EMA (Dark Cross) on March 7, two days before the crash. This was an IT Trend Model SELL Signal, the third since the Death Cross, so we would want to examine other indications to give it context.
- There was a PMO (Price Momentum Oscillator) crossover SELL Signal, which is when the PMO crosses down through its signal line (10-day EMA). Also, the PMO was falling about three weeks ahead of the crash, a condition during which we don't want to be long.
- Finally, for this chart, On-Balance Volume (OBV) was falling since August, showing volume moving out while price moved sideways.
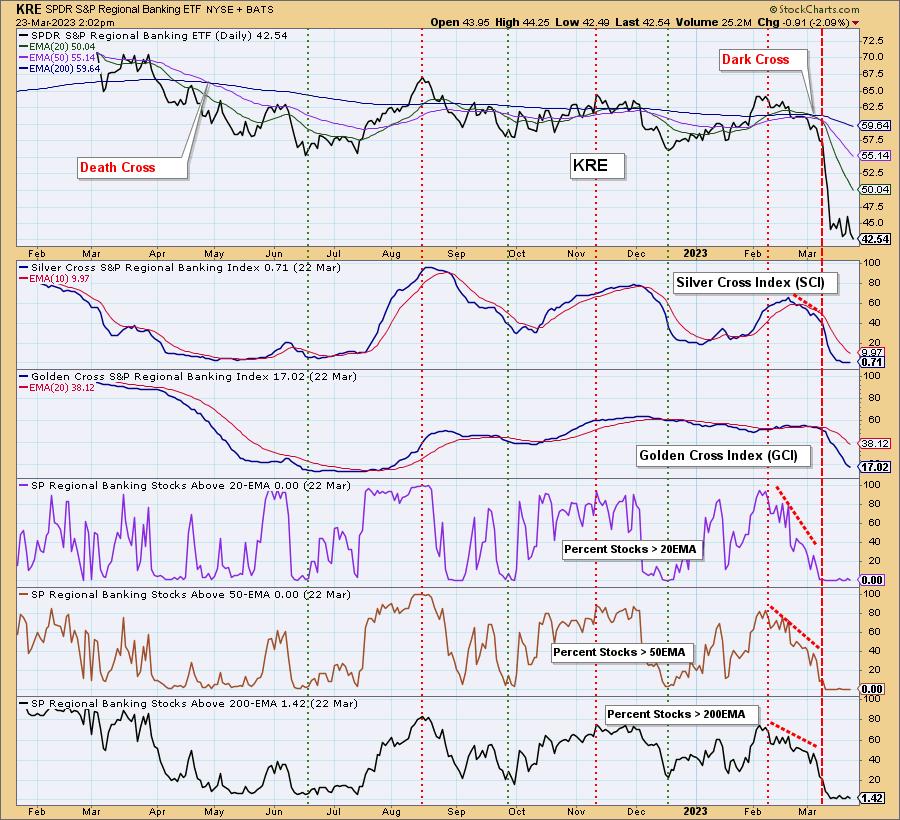
Next, our participation analysis below dumps more bearish evidence onto the pile.
- Our Silver Cross Index (SCI) shows the percentage of KRE component stocks with the 20-EMA above the 50-EMA (Silver Cross). We can see it declining and crossing down through its signal line weeks before the crash, and the reading was only 40% just before the crash.
- The Golden Cross Index (GCI) shows that only 51% of stocks had their 50-EMA above their 200-EMA (Golden Cross).
- The Percent Stocks Above 20-/50-/200-EMA showed participation crashing well ahead of the final price crash, and their readings were in the basement the day before the bottom fell out.
The Bottom Line
Waiting until a few days before the crash, there was an abundance of technical evidence telling us that KRE was not a good candidate for a long position. To say the least! While we may not have foreseen the final calamity, there was no justification for being long. At the time of this writing, on the top chart, we can see a bearish reverse pennant formation, from which price has broken down, forecasting a continuing price decline.
Watch the latest episode of DecisionPoint on StockCharts TV's YouTube channel here!

Technical Analysis is a windsock, not a crystal ball. --Carl Swenlin
(c) Copyright 2023 DecisionPoint.com
Helpful DecisionPoint Links:
DecisionPoint Alert Chart List
DecisionPoint Golden Cross/Silver Cross Index Chart List
DecisionPoint Sector Chart List
Price Momentum Oscillator (PMO)
Swenlin Trading Oscillators (STO-B and STO-V)
DecisionPoint is not a registered investment advisor. Investment and trading decisions are solely your responsibility. DecisionPoint newsletters, blogs or website materials should NOT be interpreted as a recommendation or solicitation to buy or sell any security or to take any specific action.