Today on the DecisionPoint Show Carl brought up the chart on Apple (AAPL) to discuss a recent comment from Jonathan Hoenig of the Capitalist Pig Hedge Fund on Fox Business news last week. At the time, he went out on a limb and said that he was shorting Apple. We admire his courage to take this contrarian position given most consider Apple to be teflon. We admittedly have the benefit of hindsight, but was Apple really that bearish?
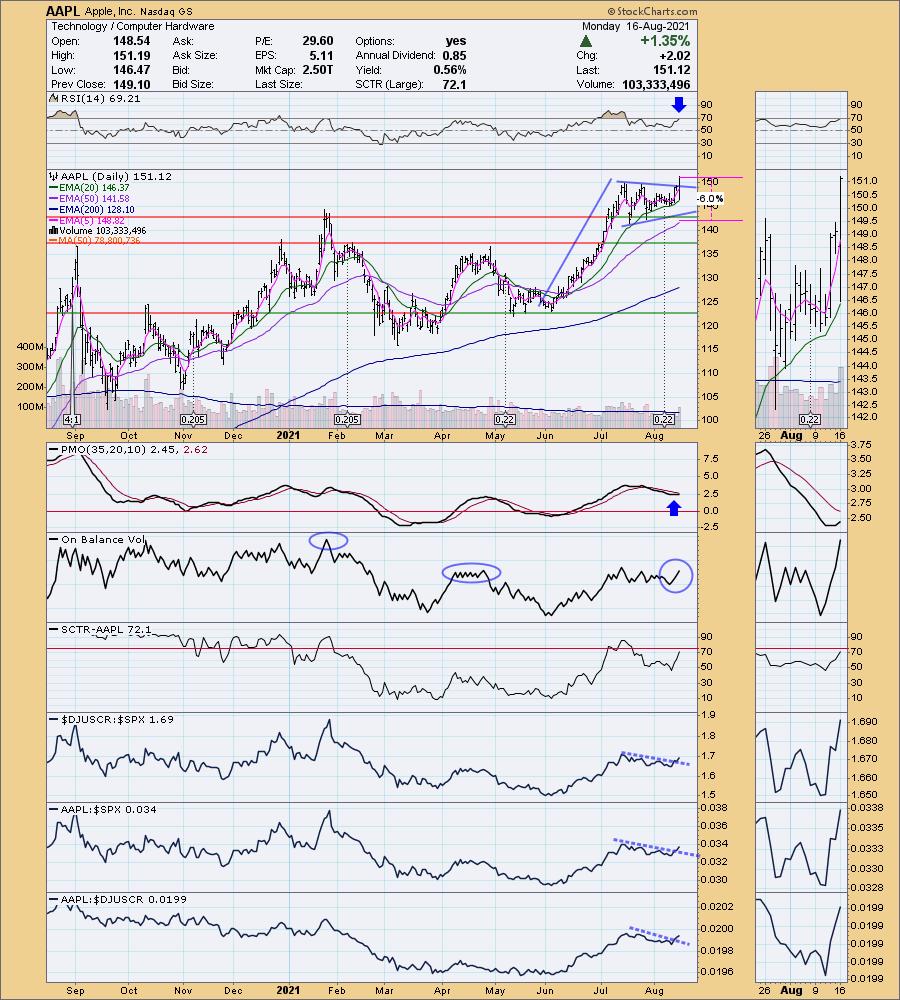
Possibly, but the technicals appeared fairly healthy. Price was forming a symmetrical triangle which formed the "flag" on the end of a flagpole. A symmetrical triangle is a continuation pattern which in and of itself is bullish. Put that triangle on a flagpole and it becomes more bullish.
We are getting confirmation of today's price breakout given the PMO has turned back up and the RSI is positive. The OBV is hit and miss. We are seeing good volume coming in on today's breakout, but notice that the OBV is barely challenging its previous tops and is well-below the January top while price is not. That is a clear negative divergence. However, there are bullish relative strength lines at the bottom of the chart that show Apple had been underperforming, but it is now breaking that declining trend.
The weekly chart is mostly favorable. The weekly PMO is on a crossover BUY signal that occurred in oversold territory. The weekly OBV doesn't have a negative divergence, in fact the rising bottoms are confirming the rally. Problems? The RSI is overbought, but as we can see it has been more overbought. The price pattern isn't good as it shows an intermediate-term bearish rising wedge.

Conclusion: Apple is in a bullish configuration and should see more upside given the execution of the bull flag with today's breakout. The weekly chart confirms positive momentum and volume. Just be careful if it gets too overbought.
Technical Analysis is a windsock, not a crystal ball.
--Erin Swenlin
(c) Copyright 2021 DecisionPoint.com

Click here to register in advance for the recurring free DecisionPoint Trading Room! Recordings are available!
Helpful DecisionPoint Links:
DecisionPoint Alert Chart List
DecisionPoint Golden Cross/Silver Cross Index Chart List
DecisionPoint Sector Chart List
Price Momentum Oscillator (PMO)
Swenlin Trading Oscillators (STO-B and STO-V)
DecisionPoint is not a registered investment advisor. Investment and trading decisions are solely your responsibility. DecisionPoint newsletters, blogs or website materials should NOT be interpreted as a recommendation or solicitation to buy or sell any security or to take any specific action.