The AD Line and AD Volume Line are aggregate measures of participation. The AD Line favors small and mid-caps because an advance equals +1 and a decline equals -1, regardless of market cap. This means an advance in Apple ($556 billion market cap) counts the same as an advance in Digital River ($475 million market cap). The AD Line is a summation of net advances (advances less declines) for each day. An uptrend in the AD Line indicates broad participation in an advance. In contrast to the AD Line, the AD Volume Line favors large-caps because large stocks usually have the most volume. Apple trades an average of 11.7 million shares per day and Digital River trades an average of 250,000 shares per day. An up day in Apple will count for much more up volume than an up day in Digital River. The AD Volume Line is a summation of net advancing volume, which is advancing volume less declining volume. A new high in the AD Volume Line indicates that more volume (money) is behind advancing issues than declining issues. Put another way, buying pressure is stronger than selling pressure.
Click this image for a live chart
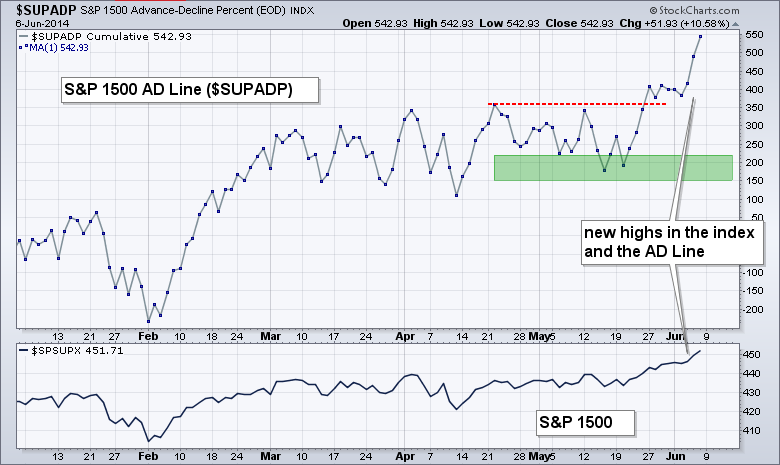
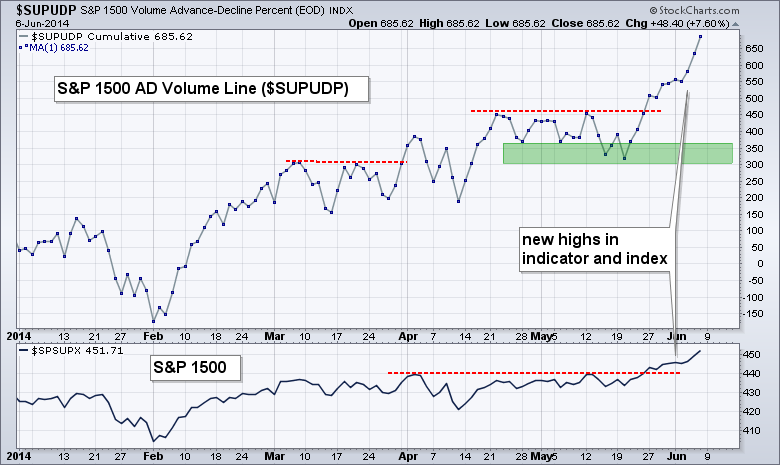
I like to use the AD Line and AD Volume Line for the S&P 1500 because this is a broad-based index that includes the S&P 500, S&P Small-Cap 600 and S&P MidCap 400. It also includes stocks from both the NYSE and the Nasdaq. Breadth indicators for the S&P 1500 combine large-caps, mid-caps and small-caps to give us a picture of the market as a whole. The chart above shows the S&P 1500 AD Line ($SUPADP) moving sideways from early March to mid May and then surging to a new high over the last two weeks. A new high in the AD Line confirms the new high in the underlying index (S&P 1500) and shows broad participation in the advance. There are no signs of underlying weakness in this indicator and there is certainly no negative divergence. The chart below shows the S&P 1500 AD Volume Line ($SUPUDP) breaking out in late May and hitting new highs this week. Confirming highs in both of these indicators affirms the uptrend in stocks and increases the odds that this uptrend will continue.
Click this image for a live chart
Good weekend, good investing and go Novak!
Arthur Hill CMT