- Large-caps Continue to Lead.
- New Highs Follow Moving Average Signals.
- Index Breadth Table Remains Bullish.
- Sector Breadth Table Remains Bullish.
- Tech-Related ETFs Continue to Lead.
- Biotech ETFs Stutter after Breakouts.
- Art's Charts ChartList Update.
 ... Large-caps Continue to Lead
The week so far is mixed for stocks with small-caps edging lower and large-caps edging higher. The S&P 500 hit the 3000 level, which is a nice round number that makes for great headlines. Truth be told, 3000 is just another number and has little technical significance, other than marking a new all time high. Sorry, I do not buy the argument that round numbers should be considered support or resistance levels just because they are big round numbers.
The Russell 2000, in contrast, fell three of the last four days and lost around 1.1%. Relative strength in large-caps has been the story for some time now and remains the story. The chart below shows SPY and QQQ hitting all time highs and leading the market. IWM remains below its May high and over 10% below its August 2018 high.
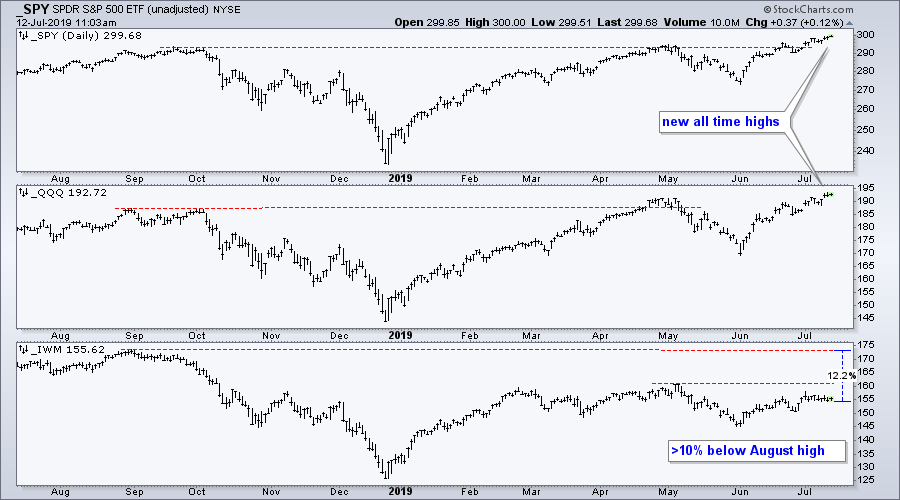
I do not view relative weakness in small-caps as bearish for the broader market. The big institutions drive the market and they are mostly active in large-caps. In addition, the S&P 500 accounts for some 80% of the total investable US equity market. Even with small-caps lagging, I cannot be bearish on the stock market when the S&P 500 is hitting new all time highs. The index may be short-term extended 9% advance in 27 days and ripe for a pullback, but overbought is more neutral than bearish. Keep in mind that it takes strong buying pressure to become overbought and strong buying pressure is bullish.
New Highs Follow Moving Average Signals
The next chart shows the S&P 500 and S&P 500 Equal-Weight Index ($SPXEW) with 4-week SMAs (green) and 40-week SMAs (red). These are equivalent to 20-day and 200-day SMAs. Moving average crossover signals are not perfect, but they filter some of the noise and help us stay on the right side of the trend. The red lines show when BOTH indexes triggered bearish moving average crossover signals and the green lines show when both experienced bullish signals. The last signal was bullish when the 4-week SMAs crossed above the 40-week SMAs in mid February. Thus, new highs are not a surprise because the trend was already up.
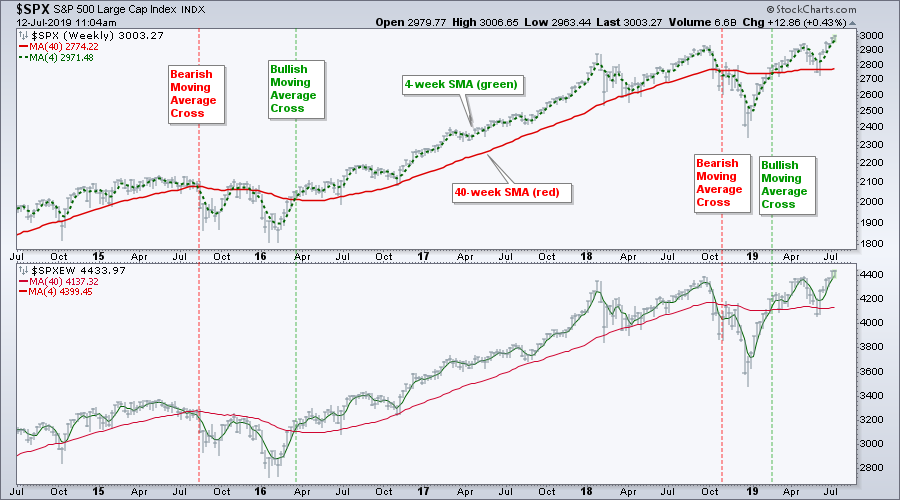
Moving average signals will never be early and will always lag. There will be whipsaws along the way, but they will catch a few good trends and these will pay for the whipsaws. Think of whipsaws as expenses and trends as income. These basic moving averages absorbed the February 2018 decline and May 2019 decline without triggering bearish signals. There was then a whipsaw from October to February. We never know how long a signal will last or how far a trend might extend. The signal is simply in force until proven otherwise. Damn, I sound like a broken record sometimes!
Index Breadth Table Remains Bullish
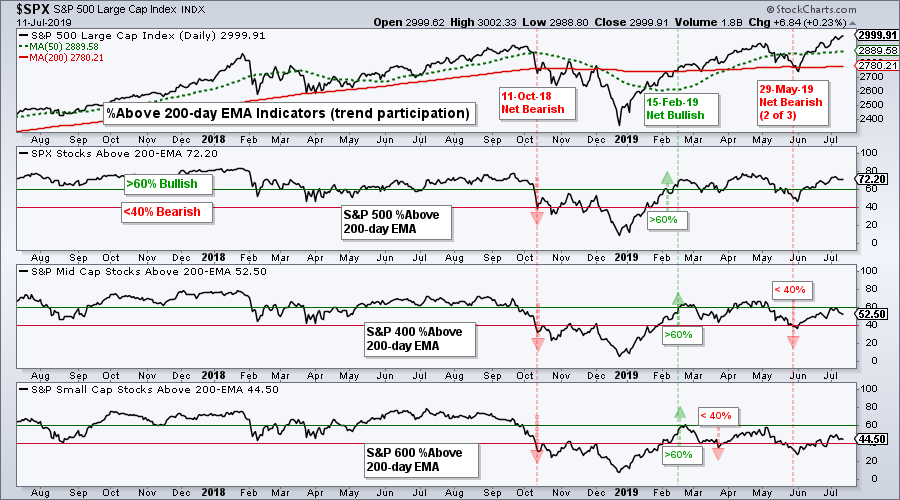
There are no changes in the index breadth table as the weight of the evidence remains bullish. The majority of indicators have been on bullish signals since February 15th and six of nine indicators are currently on bullish signals. All three indicators are bullish for the S&P 500 and two of the three are bullish for the S&P Mid-Cap 400. The S&P Small-Cap 600 remains net bearish with two of the three indicators on active bearish signals.
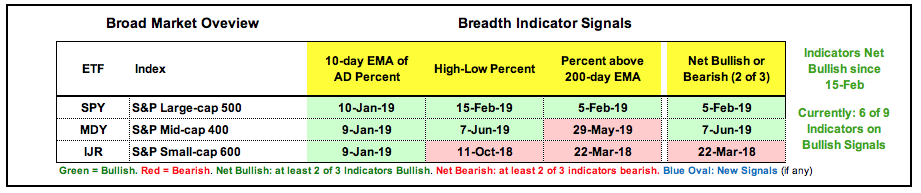
The S&P 500 %Above 200-day EMA (!GT200SPX) triggered bullish in early February with a move above 60%. Mid-Cap %Above 200-day EMA (!GT200MID) and Small-Cap %Above 200-day EMA (!GT200SML) joined with bullish signals in mid February, but small-caps flipped back to bearish in mid May and small-caps flipped bearish in late May. Thus, two of the three are on active bearish signals. The Mid-Cap %Above 200-day EMA hit 60% exactly on July 5th. I did not mark a bullish signal because the indicator did not EXCEED 60%.
Sector Breadth Table Remains Bullish
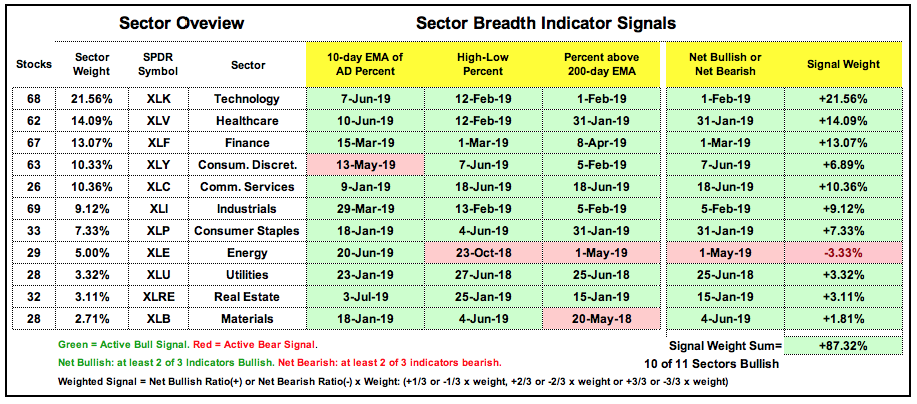
There are no changes in the sector breadth table. Ten of the eleven sectors are net bullish. Energy is the only sector with two of the three indicators on bearish signals. Consumer discretionary and materials each have one bearish signal, but are net bullish because two of three signals are bullish. All told, the total signal weight stands at +87.32% and confirms broad market strength. In a separate, but related note, XLK, XLY and XLP hit new highs in July and are the price chart leaders.
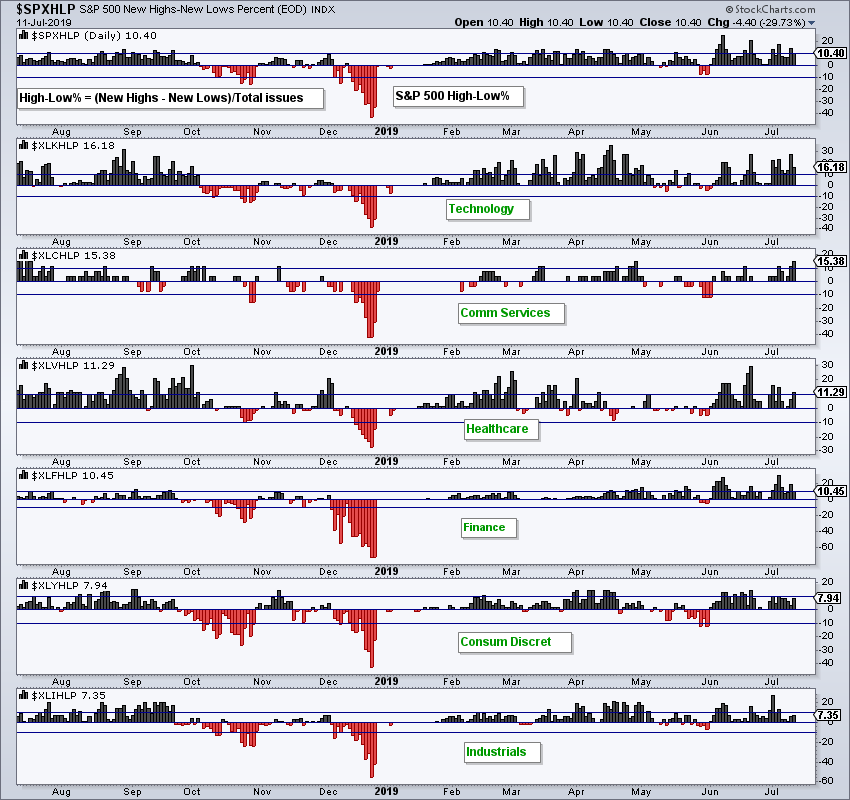
The chart below shows the six biggest sectors sorted by High-Low Percent (new highs less new lows divided by total issues). High-Low Percent exceeded 10% for the technology, communication services, healthcare and finance sectors. The Communication Services SPDR (XLC) has only 26 stocks, but the other three sectors have over 60 stocks each. Thus, on an absolute basis, technology, finance and healthcare are producing the most new highs within the S&P 500.
Tech-Related ETFs Continue to Lead
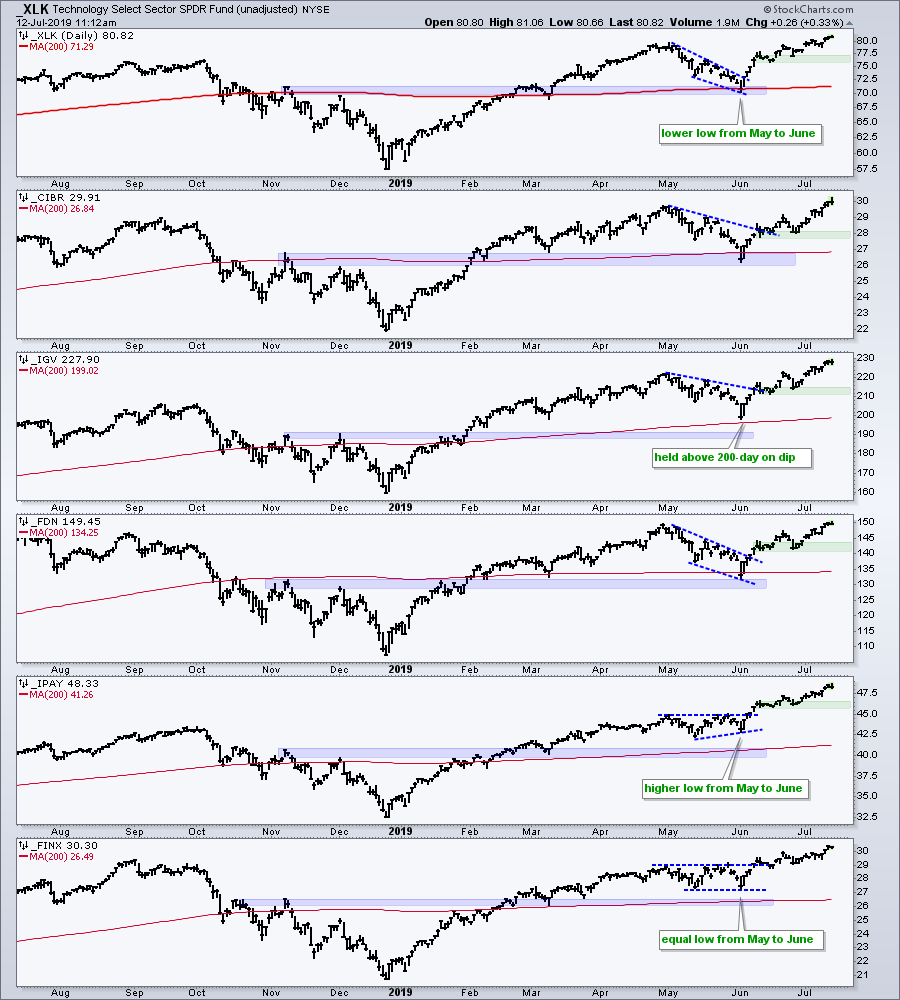
The Cybersecurity ETF (CIBR), Fintech Thematic ETF (FINX), Mobile Payments ETF (IPAY), Internet ETF (FDN) and Software iShares (IGV) are leading the market as these five hit new highs this week. No wonder the technology sector is leading overall. Of note, IGV held above its 200-day in early June, while FINX and IPAY did not form lower lows from mid May to early June. These three held up the best during the May decline and were the first to hit new highs.
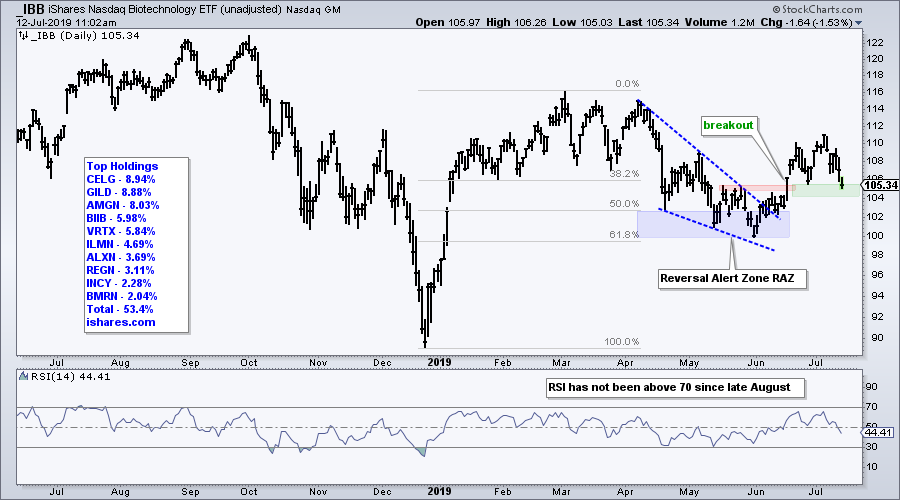
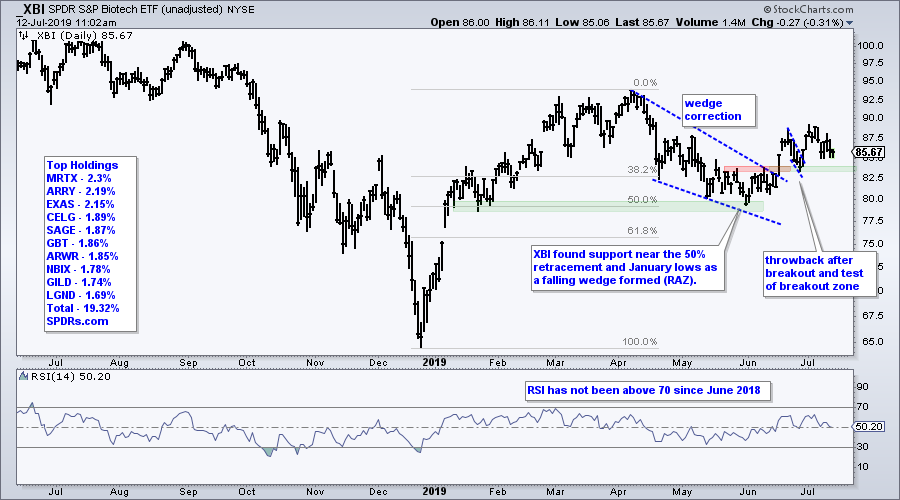
Biotech ETFs Stutter after Breakouts
The Biotech iShares (IBB) and Biotech SPDR (XBI) bounced off Reversal Alert Zones (RAZs) in early June and broke out with surges above resistance on June 17th. Both are having trouble getting traction on this breakout and stalled above the breakout zone. The breakouts are still valid, but I would watch closely for two reasons. First, IBB and XBI are not leaders because they are below their spring highs, which are well below their 2018 highs. Second, upside momentum remains subdued because RSI(14) has not been able to exceed 70 in several months. A close below the green support zones would negate the breakouts.
Art's Charts ChartList Update
The Art's Charts ChartList has been updated with 30 curated stock charts. These charts were selected based on observations this week and the RSI-Aroon chart scan in this System Trader article. Some charts remain from week to week and some change. The idea is to provide a curated list of stocks to watch for the week(s) ahead.
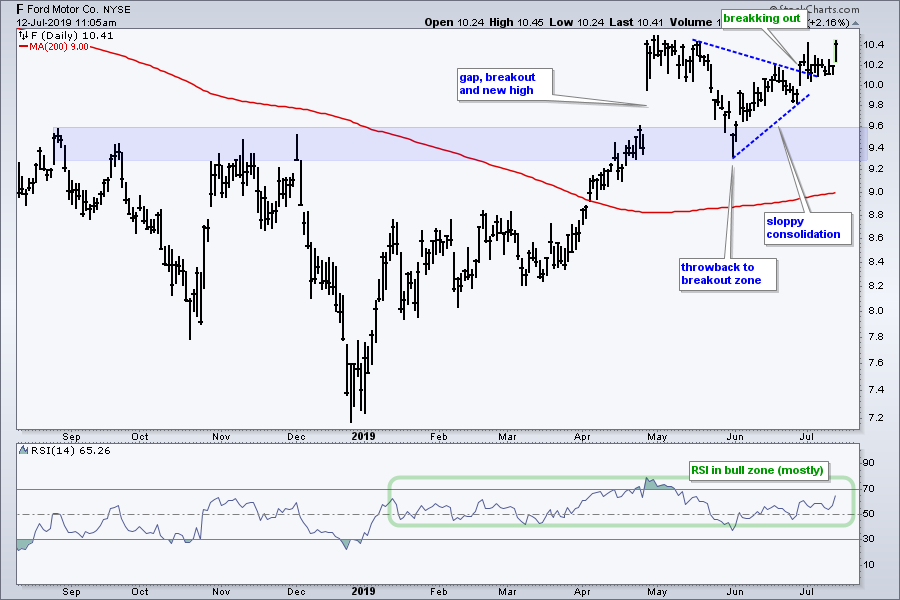
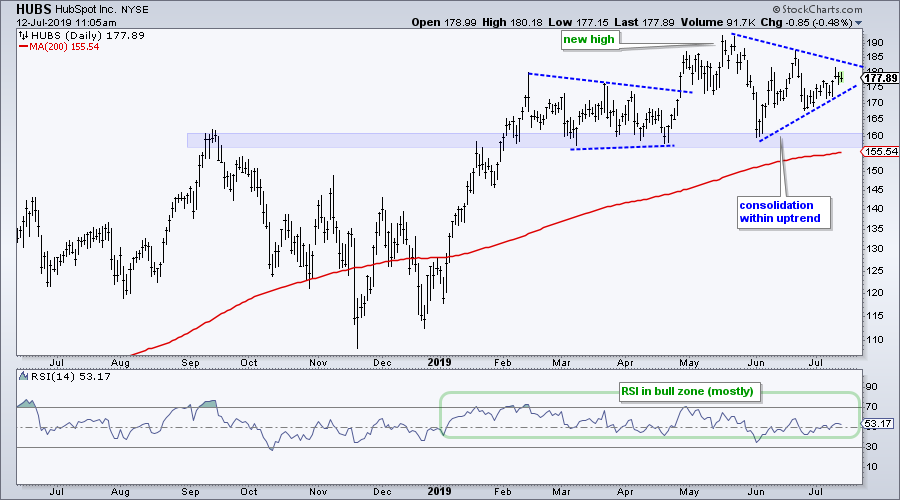
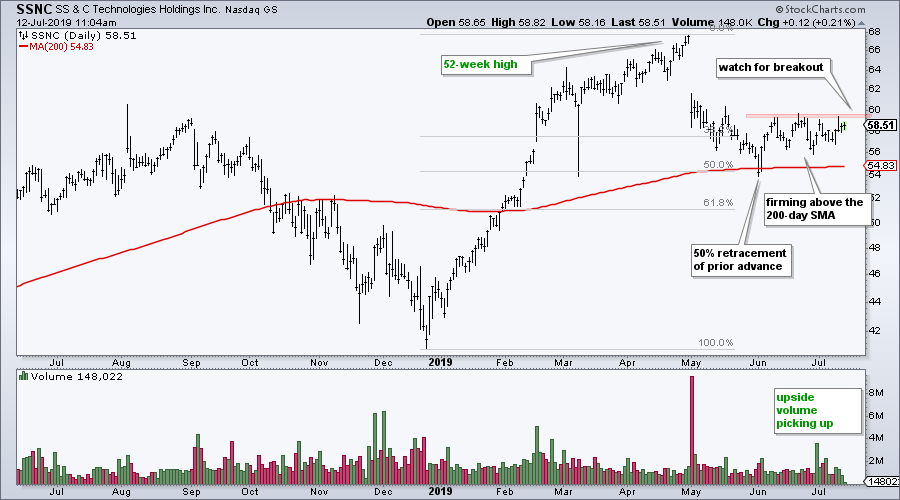
The next five charts highlight some setups in the making. Outside of these charts: ACAD is breaking out of a consolidation. AKAM is hitting new highs after a breakout in June. CDNA and EW have cup-with-handle patterns working. CSCO is breaking out of a triangle consolidation. CMCSA is leading large-caps with a breakout to new highs this week.
Click here for the Art's Charts ChartList
Questions, Comments or Feedback?
I do not take symbol request and I cannot promise to response to all correspondence, but I will read it and take into under consideration. I greatly appreciate all feedback because it helps me improve the commentary and provides ideas for the future.

Plan your trade and trade your plan.
Arthur Hill, CMT
Senior Technical Analyst, StockCharts.com
Author, Define the Trend and Trade the Trend Paper: RSI for Trend-Following and Momentum Strategies
Want to stay up to date with Arthur's latest market insights?
– Follow @ArthurHill on Twitter
– Subscribe to Art's Charts
– Watch On Trend on StockCharts TV (Tuesdays / Thursdays at 10:30am ET)