Another insightful issue of the ChartWachers Newsletter has arrived!

Delivering The Web's Best Financial Commentary Straight To Your Inbox

May 6, 2017

Hello Fellow ChartWatchers!

Welcome to the latest edition of ChartWatchers, the newsletter for technical analysts, online investors, StockCharts users and more. In addition to this week's articles, we have some important announcements for you!

Earlier this week, we officially launched our new Members Dashboard. As a member, this page is the heart and soul of your StockCharts account. It's the first page you see when you log in and the center of all your personalized features like ChartLists, Scans, Alerts and more. With that in mind, we've redesigned the page to be more intuitive, easier to navigate, and optimized for all screen sizes.

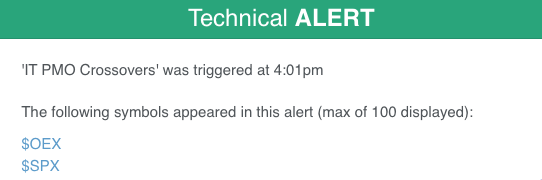
For example, the new-and-improved Control Center features a scrollable list of quick links to our members-only features, charting tools, market summary pages and more. We've added an Alert Center, and made it easy to jump straight to your ChartLists, saved scans or custom alerts using the 3 grey buttons in the top right corner of the page. Plus, the new Dashboard includes the market overview and "top 10" reports that used to live on our home page, making it quicker than ever to stay up to date on the day's market action.

There's more information about the new Dashboard than I can cover here, so don't miss our Video Tour of the new Dashboard! Click Here to watch now.

Lastly, you may have noticed that the StockCharts home page has changed. As mentioned above, you can now find the market overview data and other reports on the Members Dashboard. Simply click on the Members tab at the top of the page (and bookmark that page in your browser for quick access!).

If you are not yet a StockCharts Member, now is the perfect time to sign up for a free 1-month trial. Click the big green button on the StockCharts home page to get started! Otherwise, you can still access our free charts, tools and other features on the Free Charts page. Look for the Free Charts tab at the top of any StockCharts web page.

Until next time!

- Grayson Roze

Having trouble viewing this email? Click Here to view online

Site News

New "Top Advisors Corner" Author: David Keller, CMT

I am pleased to announce that we have recently added a new author to our Top Advisors Corner blog. David Keller, CMT, was most recently a Managing Director of Research for Fidelity Investments in Boston. He managed the Technical Analysis team at Fidelity Management and Research, as well as the legendary Fidelity Chart Room. He is also a former President of the Market Technicians Association (MTA) and has lectured on technical analysis and behavioral finance as an Adjunct Professor at the Brandeis University International Business School. We're thrilled to welcome David to our team of expert contributors! Click Here to read his first article.

This Week's Articles

The Market Message

Sector Rankings and Weightings Are Still Market Positive

Article Image SECTOR LEADERSHIP... One of the problems facing the current stock market is that some sectors have been rising, while others have suffered large losses. Since the start of the year, for example, technology has gained nearly 14% versus a 6.7% gain for the S&P 500. Energy stocks, however, have plunged -10% this year. Industrial metal miners have lost -6% as have telecom stocks...
Read Article

Bookstore Special

Art's Charts

Create McClellan Oscillators for the Nine Sector SPDRs and the Gold Miners

Article Image The McClellan Oscillator is a breadth indicator that Chartists can use to enhance their analysis of an index. StockCharts carries the McClellan Oscillator for dozens of broad market indexes, but not for the S&P sectors. There is no need to fret because StockCharts users can create the McClellan Oscillator using the AD Percent...
Read Article

The Canadian Technician

Financials Underperform After The Fed Meeting

Article Image It seems that nothing is ever easy in the market, but following price action is really important as we know. Following the November 1-2, 2016 Federal Reserve meeting, Banks (Financials in general) went ballistic as it looked very probable that the Fed would raise rates at the December meeting. Coinciding with that was the election of President Donald Trump a week later. It is
Read Article

InvestEd Central

Earnings Season Favors the Bulls

Article Image Recent headlines have focused on tax reform, health care reform, partisan bickering, the president's first 100 days. But in the background many companies have been coming up big when reporting earnings which is why the market has been so strong of late. While the bears have been hoping for a big pullback the bulls have gone about their business with the NASDAQ hitting an all time high while the...
Read Article

DecisionPoint

Whipsaw Intermediate-Term PMO BUY Signals on SPX and OEX

Article Image I had already figured out what I would write about in today's ChartWatchers article, but that was put on hold when I received a Technical Alert in my email box telling me that we had IT Price Momentum Oscillator (PMO) signal changes on both the S&P 500 and S&P 100. These signals are generated on the weekly charts. Now, looking at the DP Scoreboards below, there is
Read Article

The Traders Journal

Where My Best Investments & Trades Came From These Past 25 Years Part 1

Article Image Approximately every five years, I dig into my Trading Journal with the specific mandate to unearth and review where I've earned my profits and losses. This is not a small project. I do it on an ongoing basis with all individual trades, but when taken in the 5-year aggregate, the insights are more profound. I breakdown my trades into four groups: Good Losses:...
Read Article

See More Articles …

Become a Member

Become a Member

Unlock All of Our
Tools and Features

  • + Larger, Full-Screen Chart Sizes
  • + Intraday Charts with Real-Time Data
  • + Exclusive, Members-Only Commentary
  • + Custom Technical Scans and Alerts
Free 1-Month Trial
Visit ChartSchool

About ChartWatchers

ChartWatchers is our free, twice-monthly newsletter for online investors and StockCharts users. Whether you are brand new to charting or a seasoned analyst, each edition of ChartWatchers brings you insightful, expert commentary from the industry's leading technicians. See what's really happening in the markets through their eyes and gain an edge in your own investing.

f t
For more information about the ChartWatchers Newsletter or to subscribe for free, Click Here
This email was sent to [email]. Need the newsletter sent to a different email address?
Simply unsubscribe your current email, then re-subscribe using the new address.
Click Here to instantly unsubscribe