Another insightful issue of the ChartWachers Newsletter has arrived!

Delivering The Web's Best Financial Commentary Straight To Your Inbox

February 4, 2017

Hello Fellow ChartWatchers!

Well folks, you asked, and we've delivered!

After the success of last month's "2017 Market Outlook" webinar, Tom Bowley and Greg Schnell will be back again next weekend for another exclusive show! Join us live on Saturday, February 11th at 11:00am EST as Tom and Greg debate current market positioning, share their outlook for where the market is heading and provide powerful insights into how they use the charting tools and features on StockCharts.com. After back-to-back presentations from these two experts, they'll open things up for live Q&A, giving you a chance to get involved and become a part of the show!

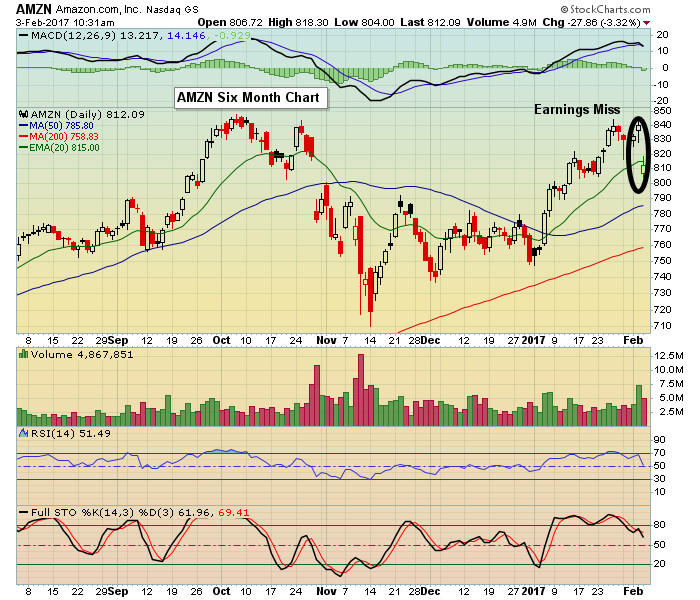
Tom will dive deeper into the strategies he uses to trade gaps. As the latest earnings season winds down, this is a topic that couldn't be more timely. Thousands of companies have reported quarterly earnings in recent weeks, creating both bullish and bearish gaps throughout the market. Tom will describe the various types of gaps (common, breakaway, continuation and exhaustion), explain the importance of volume in analyzing gaps, and discuss the various support levels you should be watching in each gap type.

Greg will examine the recent lack-luster performance of the Energy sector, which has been drifting lower for nearly two months as crude holds above $50. This period is traditionally quite bullish for energy, so he’ll share his take on what needs to happen for this historical strength to kick in. Greg will also demonstrate how to most-effectively use our CandleGlance tool and customize its settings to quickly analyze a group of securities, such as the components of an industry group.

The webinar will take place next Saturday, February 11th at 11:00am EST, and will be reserved exclusively for StockCharts Members. Keep an eye on the webinar calendar, either on the home page or the Webinars page, and register for the show to save your spot. Registration will open up early this week.

If you're not already a StockCharts Member, this is a great time to start your FREE 10-day trial! You'll unlock all of our most powerful tools and features AND get access to Tom and Greg's exclusive webinar. There's nothing to lose! To get started for free, Click Here!

Enjoy!

- Grayson Roze

Having trouble viewing this email? Click Here to view online

Site News

NEW! Weekly "Video Blogs" from Arthur Hill!

In case you haven't seen the latest addition to the Art's Charts blog, Arthur Hill is now posting weekly market review and outlook videos! Published at the end of each week, these videos deliver Arthur's insightful market commentary in a new form and allow him to review and analyze a full week of market action after the close on Friday. They also accompany the written commentary that Arthur posts in his blog. Check it out!

This Week's Articles

The Market Message

Dow and S&P 500 End Week On a Strong Note

Article Image What started off as a soft week for stocks ended on a strong note. Friday's gain was enough to keep stock indexes basically flat for the entire week. But there was some improvement on the charts. The daily bars in Chart 1 show the Dow Industrials jumping 186 points (0.94%) on Friday. That was more than enough to keep it well above its 50-day average and chart support along its...

Read More >

Bookstore Special

Art's Charts

New Highs Expand in the Healthcare Sector

Article Image New highs are a sign of underlying strength and chartists can measure this indicator using High-Low Percent. In particular, I like to rank the nine sectors by High-Low Percent or a moving average of High-Low Percent. Note that High-Low Percent equals new highs less new lows divided by total issues. Chartists looking for the weekly leaders in High-Low Percent can look at the 5-day SMA. The table...

Read More >

The Canadian Technician

BioTechs Are In The Starters Blocks. Will The Run Start Soon?

Article Image The Biotech arena has been a "House Of Pain" for investors while the companies continue to deliver all sorts of pain remedies to people worldwide. But the pattern shaping up on the Biotech ETF's suggests they are one to watch closely. Even the recent tough talking banter couldn't push the Biotechs down. This is the SPDR Biotech ETF (XBI). Looking at two other Biotech

Read More >

Trading Places

Using Support, Resistance And Trendlines To Better Your Trading

Article Image Exercising patience and discipline to enter trades at appropriate reward vs. risk levels is obviously very important to any trader's success, but planning trades before they set up is just as important. Let me give you a few examples. First, let's take a look at Cullen Frost Bankers (CFR): Trendlines are only as strong as the number of price points that are connected. You can...

Read More >

InvestEd Central

No Chasing Allowed

Article Image At EarningsBeats we are steadfast in avoiding being involved in stocks into a company's earning's report because one can never tell how the market will respond to a company's numbers. Case in point is Amazon who reported their numbers last week. Just look at the chart below and you will see that the stock was poised to break out the day earnings were reported which was February 2. However when...

Read More >

DecisionPoint

Stocks Relative to Their 52-Week High-Low - SPX v. NDX

Article Image Today during my DecisionPoint Report webinar, I pulled the intermediate-term indicator chart of SPX Stocks Relative to Their 52-Week Hi-Lo to show my viewers the divergences that are all over this chart. After I finished the webinar and reviewed the chart again, I decided it would be great to see what the same chart for the NDX looked like. It's

Read More >

The Traders Journal

How Investing, Brain Training and Longevity Fit Together

Article Image Yes, the fountain of youth really does exist, and academic research is increasingly proving it to be found amidst your investment portfolio. A growing body of scholarly research shows that, in many ways, life can get better as we get older, and being an active investor can contribute in significant ways. If this sounds familiar to some of you, it is because in fact this was how I...

Read More >

See More Articles …

Learn more about Technical Analysis, investing and much more by visiting ChartSchool, our online educational resource!

Visit ChartSchool

About StockCharts

Trusted by thousands of online investors, StockCharts makes it easy to create the web's highest-quality financial charts in just a few simple clicks. We offer an extensive collection of award-winning analysis tools to help you see what's really happening in the markets. Get started today with our free tools and resources today and see what better financial charting can do for you.

About ChartWatchers

ChartWatchers is our free, twice-monthly newsletter for online investors and StockCharts users. Whether you are brand new to charting or a seasoned analyst, each edition of ChartWatchers brings you insightful, expert commentary from the industry's leading technicians. See what's really happening in the markets through their eyes and gain an edge in your own investing.

f t
For more information about the ChartWatchers Newsletter or to subscribe for free, Click Here
This email was sent to [email]. Need the newsletter sent to a different email address?
Simply unsubscribe your current email, then re-subscribe using the new address.
Click Here to instantly unsubscribe