| View Online Forward to a Friend |
|
 |
Delivering The Web's Best Financial Commentary Straight To Your Inbox
|
| November 19, 2016 |
Hello Fellow ChartWatchers!
Well, here we are. The final ChartWatchers Newsletter of 2016. Temperatures outside may be chilly, but here's a little something to warm you right up: our special holiday pricing is still in effect!
In case you haven't heard, for a limited time only this month we're offering some serious savings off our regular subscription pricing. We're throwing in 2 FREE months of service when you sign up for a 12-month subscription, or 1 free month when you sign up for a 6-month subscription. And remember, these special holiday deals apply to both new accounts and renewals of existing subscriptions, so sign up now and save, or renew your membership to catch our holiday pricing while it lasts.
If you're not yet a StockCharts Member, now is the best time of the year to join! To sign up for a brand new StockCharts account, click this link and select the service level that fits you best.
If you are already a member and your account expires before June 2017, we strongly recommend you renew now to take advantage of our special pricing. You can do so from the Your Account page. Log in to your StockCharts account, head over to the Members page and look for the yellow box in the upper right corner. You'll see a link there that says "Your Account Settings". On that page, scroll down to the Subscription Plans table and click the yellow "Extend" button to get started! If you're logged in to your StockCharts account, Click here to head straight to the Your Account page.
As 2016 comes to a close, I want to thank all of you, our loyal StockCharts users, for your continued support. From all of us here at StockCharts, we want to wish you the happiest of holidays and a prosperous New Year. See you in 2017!
- Grayson
Having trouble viewing this email? Click Here to view online
|
|
|
|
DON'T MISS THE HOLIDAY SPECIAL
We really can't stress this enough. Whether you're a new user or a longtime subscriber, this is the best time of the year to sign up. Start a new account or renew your existing membership today! Check out the links and instructions above in the "Hello Fellow ChartWatchers" section for more details about how to get started.
Tom Bowley and Greg Schnell Have a Special Announcement!
Be sure to read Tom's article in this week's newsletter for a special announcement regarding some really exciting commentary events coming up in 2017. Tom and Greg have some awesome stuff planned for next year, and you won't want to miss it!
|
|
|
|
|
|
|
by John Murphy
|
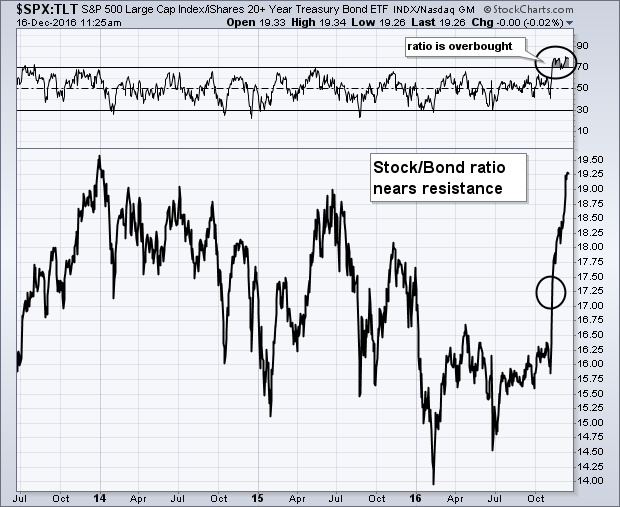 |
Several market messages over the past couple of months used relative strength ratios to paint a more bullish picture of the stock market, and a more bearish picture for bonds. While those ratios have strengthened considerably, especially since the election, I'm a little concerned that they're starting to look stretched. On October 28, I showed a ratio of the S&P 500...
Read More > |
|
|
|
|
by Arthur Hill
|
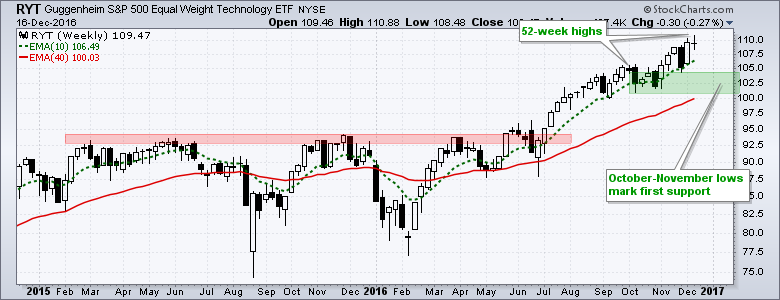 |
Even though the finance, energy and industrials sectors are grabbing most of the headlines these days, the tech sector is doing just fine with the Nasdaq 100 ETF (QQQ), the Nasdaq 100 EW ETF (QQEW), the Technology SPDR (XLK) and the EW Technology ETF (RYT) hitting new highs this week. We are not talking new 52-week highs, but new all time highs. In addition, the Cloud Computing ETF (SKYY) and...
Read More > |
|
|
|
|
by Greg Schnell
|
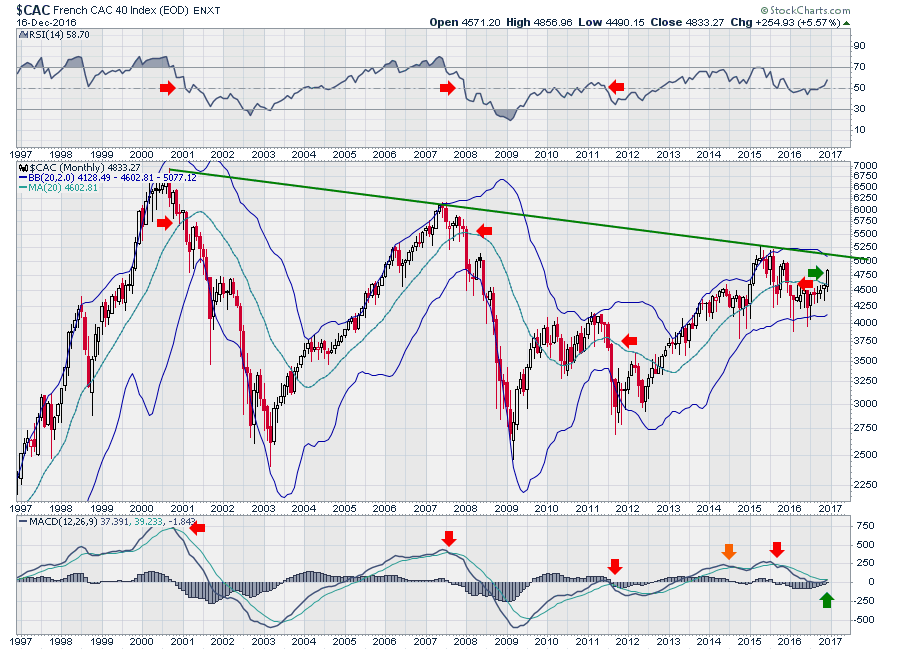 |
There are some very important macro charts starting to come into play globally. These are monthly charts, so we need to check these at the end of December, January and February. The collection of charts shows how big a global bull market could be if they all break through. First of all, France looks like it wants to test the 16-year, long term trend. This chart for the Nikkei in Japan...
Read More > |
|
 |
|
|
|
by Tom Bowley
|
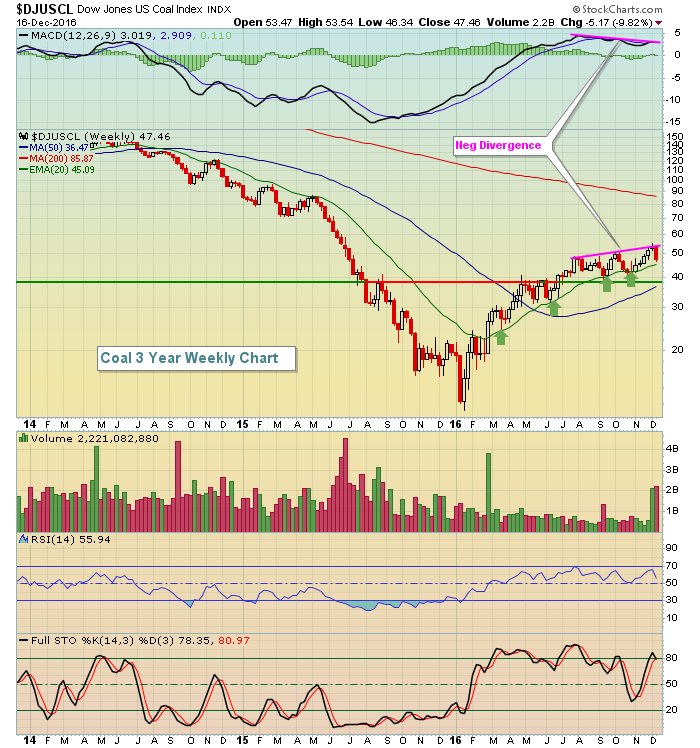 |
We're two weeks away from another stock market year in the books. Where does the time go? Anyhow, since this is the last ChartWatchers newsletter of 2016, it would be an appropriate time to check out the best and worst industry group awards for 2016. Drum roll please! Best 2016 Industry Group: Dow Jones U.S. Coal Index ($DJUSCL, +143.14% YTD) While it would...
Read More > |
|
|
|
|
by Erin Heim
|
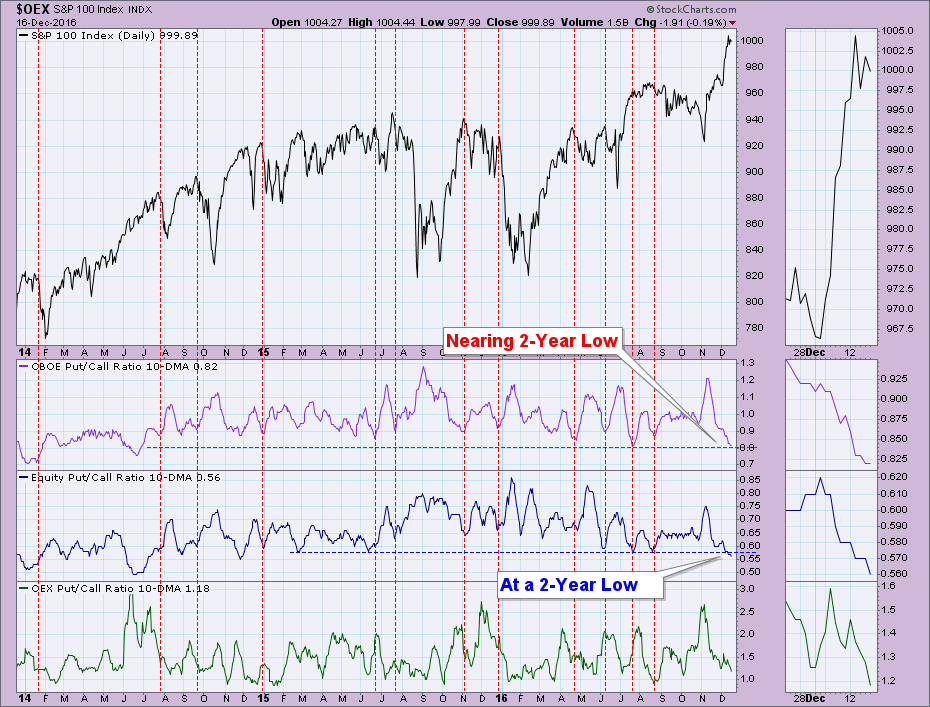 |
A webinar viewer recently sent me a chart showing put/call ratios nearing extreme lows. I pulled up the chart and indeed, the 10-DMA of the put/call ratios are nearing or are at two-year lows. What does this actually mean? As the ratio gets smaller and smaller, that means that the amount of calls is accelerating faster than puts. When...
Read More > |
|
|
|
|
by Gatis Roze
|
 |
You can't download stock market wisdom. You have to experience it firsthand and practice it. In a nutshell, that is precisely what these Action Practice blogs every two weeks are all about. The previous Action Practice (#7) presents a tool for uncovering individual investors' tolerances for risks and rewards. The exercise was intended to identify the personal balance...
Read More > |
|
|
|
Learn more about Technical Analysis, investing and much more by visiting ChartSchool, our online educational resource!
|
|
|
|
|
|
|
|
| For more information about the ChartWatchers Newsletter or to subscribe for free, Click Here |
This email was sent to [email]. Need the newsletter sent to a different email address?
Simply unsubscribe your current email, then re-subscribe using the new address. |
| Click Here to instantly unsubscribe |


