The Fed's surprising move last Tuesday did wonders for the major averages and "wrecked" many technical forecasts in the process (oh well). As you can see below, Tuesday's rally moved the Dow well above the 50-day Moving Average (blue) which had been providing some resistance prior to that time.

The CMF and MACD lines also strengthened significantly as a result. So everything must be looking up right? Well... Check out this chart:

This is a MarketCarpet chart (Java required) for all of the stocks that make up the S&P Sector ETFs. Each square represents a different stock. They are grouped into the 9 major S&P sector categories. The color of each square is determined by the percentage increase (green) or decrease (red) that each stock has had since the Fed made its move on Tuesday. To read this chart, look to see if the overall color of a given sector tends towards green (bullish) or red (bearish).
As you can see, many of the stocks on this charts are tending towards the red - especially in the Consumer Discretionary and Financial sectors. Only the Energy sector is showing lots of green. This indicates that there hasn't been much follow thru since the Fed's move on Tuesday and that the downward pressure that was in place prior to Tuesday may still be having an impact.
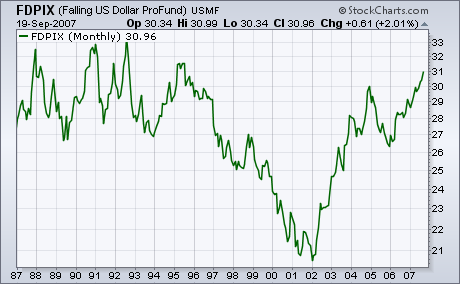
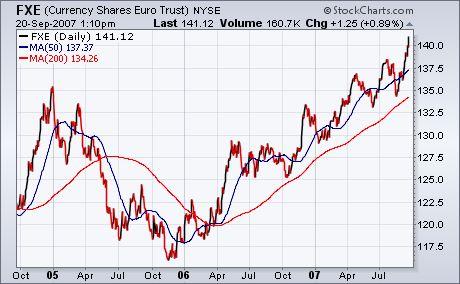
I first wrote about this inverse dollar fund in April 2006 and again on July 13 of this year. The ProFund Falling US Dollar Fund (FDPIX) is a mutual fund designed to trade in the opposite direction of the US Dollar Index. In other words, the fund rises when the dollar falls (hence its name). As I've suggested in the past, investors can use this fund to profit from a falling dollar. Chart 1 (plotted through 9/9) shows the Falling Dollar Fund trading at a new 12-year high. An alternative to buying a dollar inverse fund is to buy a foreign currency ETF. Chart 2 shows the Currency Shares Euro Trust (FXE) hitting a new high on 9/20 along with the Euro.
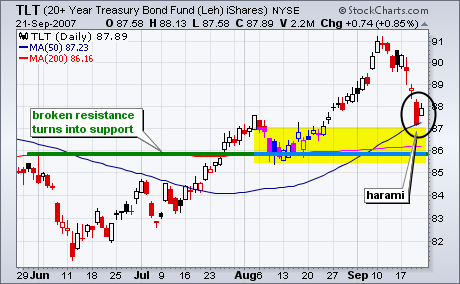
Buy-on-Rumor and Sell-on-News is a classic Wall Street axiom. In the internet heyday, Yahoo! would surge into its earnings announcement and then correct with a pullback near the actual announcement. The iShares 20+ Year Bond ETF (TLT) surged with the lead up to the Fed meeting on Tuesday and peaked a few days before the announcement. The rumor was the Fed cut and traders bought into this rumor in the second half of August. Traders took profits after the rate cut (news) was priced into the bond market.
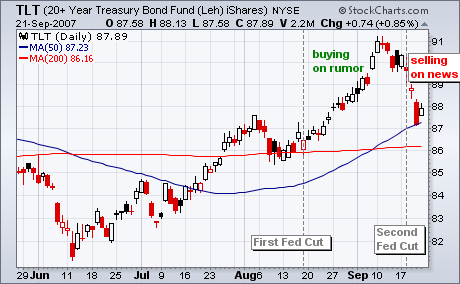
Despite the rather sharp pullback, the overall trend remain up and TLT finished the week in a support zone. The support zone stems from broken support, the 200-day moving average and the 50-day moving average. In addition, there is also support from the early August consolidation. A harami formed over the last two days with a long black candlestick and a smaller white candlestick (inside day). This shows sudden indecision and also indicates support. The overall trend remains up for TLT and I would expect the ETF to hold this support zone before continuing higher.
Ever since the market hit its correction lows in August I have written three articles, each emphasizing that the odds favored a retest of those lows (see Chart Spotlight on our website). As it turns out, we haven't had any decline that I would classify as a retest, and the market has broken out of a triangle formation on high volume. When the breakout happened, it eliminated any reasonable possibility of a retest, in my opinion. Sometimes the low odds take it.
One thing I have been cautioning about is to not get too bearish, because many of our key indicators had remained bullish. Another thing I should mention is that we should never get too invested in a forecast. I have watched as many of my bearish colleagues, after being proven wrong by the market, are still tying to justify their being bearish rather than trying to get aligned with the market. The market will eventually prove them right because, because, because . . . Maybe they will be right sooner than we think, but for now the market looks as if it will be moving higher for a while.
My bullish stance is due to our S&P 500 timing model having switched from neutral to a buy on September 13, three trading days prior to the Fed-induced market breakout. Also, prior to the breakout, about half of the market and sector indexes that we track with our primary timing model were also on buy signals. On the day of the breakout, the other half switched to buy signals.
The chart below shows the two components needed to generate a buy signal â the Percent Buy Index (PBI) crossed above its 32-EMA, AND the PMO (Price Momentum Oscillator) was above its 10-EMA. Note that the PBI is only at 59%, but it is trending up, which is most important.
Bottom Line: The long-awaited retest did not materialize, and. in my opinion, the market has begun another leg upward that should challenge and exceed all-time highs for the S&P 500 Index.
It's been a very long time, but we can now unequivocably say that we have an accommodating Fed. The lowering of interest rates was the next piece of our bullish jigsaw that fit perfectly. It's all coming together. The bond market knew it was coming. You just have to follow the technicals. Take a look at the weekly chart of the 10 year treasury yields over the past decade and a half.
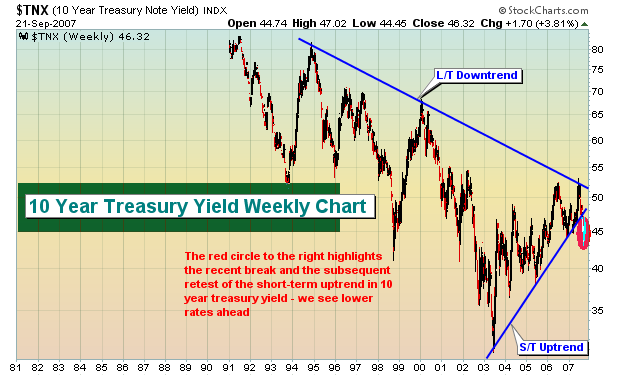
There is a long-term downtrend in rates that remains intact. The short-term uptrend that began in 2003 came to an end just before the recent Fed announcement. How long will we trend lower? That's a good question and a tough one. We expect the Fed will lower at least 1-2 more times and then re-evaluate our economic outlook. That would get the fed funds rate back down to the 4.00-4.25 area. From a technical perspective, we believe the yield on the 10 year treasury will ultimately drop to the 3.80-4.00% level. The economy should begin to grow more steadily late in the first half of 2008 and that may require the Fed to consider tightening again sometime in the second half of 2008 or early 2009.
Equities flourish in a growing economy with falling interest rates and little inflation. That is our forecast for the next 12 months and the primary reason we remain extremely optimistic and bullish. We have stated that the recent weakness was a buying opportunity as we expect equities to post very solid gains over the next 1-2 years. Focus on the large multinational growth companies found on the NASDAQ 100 for the balance of 2007, then be ready for a broad-based advance in 2008. Expect semiconductors to lead the rally into year end.
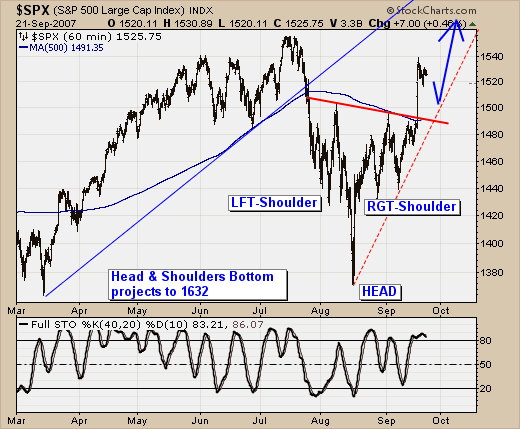
The "surge" of the past month in the S&P 500 is nothing short of astounding; and given the technicals involved â we believe prices are set to continue moving higher with a projection to 1630 into the October-December time frame. This represents a +6.8% rally from the Friday, September 21 close.
Quite simply, when we look at the S&P 500 hourly chart; we find a very picturesque "head & shoulders" bottoming pattern that was confirmed with the breakout above neckline resistance at 1496. Our target is arrived at using the percentage gain +9.1% off the 1371 low to neckline resistance at 1496, and then applying the gain to 1496 to arrive at 1632.
The question before all of us is "how do we get there", and what sectors will outperform and which will underperform. This is important as we believe an "important top" will form at 1632 given the current advance/decline line of NYSE "operating companies only" is lagging rather badly on the rally thus far. Typically, the advance/decline line tops out 4-6 months before prices do so; which occurred in June-2007. Hence, our target time frame of October-December 2007.
And finally, we'll also note that the hourly "head & shoulders" bottom 1632 target roughly converges with the weekly "head & shoulders" bottom breakout in 2004 that targets 1650; and speed-line resistance off the September-2001 bottom connecting the January-2004 high and the June-July 2007 highs. Attention is to be paid when various methods of technical analysis converge; and we are doing so.