Happy Holidays everyone! And welcome to the holiday edition of ChartWatchers. This special edition replaces our normal December issues and it contains several exciting announcements about the markets and StockCharts.com. Be sure to check out the Site News section for more on StockCharts including news about our holiday subscription special.
As always our columnists have been watching the markets very closely - especially the gold market. John Murphy starts things off with a look at gold's recent breakout while Richard Rhodes is monitoring the Dow/Nasdaq ratio. Carl Swenlin has his eyes on spot gold prices and finally Arthur Hill sees an opportunity on the Newmont Mining chart.
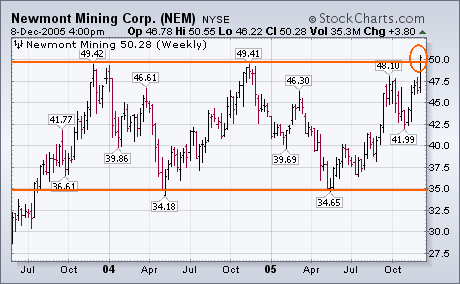
Gold bullion climbed over $5.00 today to end at $519 which is the highest level in twenty-four years. Gold has now exceeded its 1983 peak at $514. Despite my concerns about a possible pullback around the $500 area, bullion shows no signs of slowing down. That may be partially due to the bullish action in gold stocks. Although the XAU Index had recently achieved a major bullish breakout, Newmont Mining (the biggest stock in the XAU) hadn't yet done so. Neither had the AMEX Gold Bugs Index (HUI). The next two charts show, however, that both have now joined the XAU in new high ground. The weekly bars in the first chart show Newmont closing over 50 for the first time in two years. The second chart shows the HUI breaking through its late 2003 highs to achieve a bullish breakout as well. The HUI/SPX ratio in Chart 7 has just broken a two-year down trendline. That's tells me that gold stock leadership is going to continue as is the bull market in bullion.
">
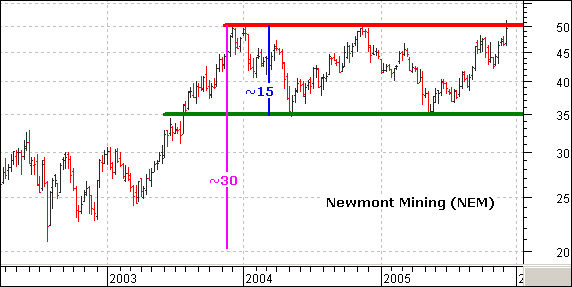
Since NEM first broke above 35, gold has advanced from below 400 to above 500. However, NEM remains stuck in a long-term trading range. Did NEM secretly hedge production? Probably not, but the stock is not keeping up with gold, which broke above its 2003 and 2004 highs.
NEM is current challenging resistance and a close above 51 would be long term bullish. The pattern looks like a sharp advance and (20-50) and long flag (35-50). A break above 51 would signal a continuation of the prior advance and project a move to around 65 (50 - 20 = 30, 35 + 30 = 65). We could also consider the trading range as a large rectangle formation and a breakout would project a move to around 65 (50 - 35 = 15, 50 + 15 = 65). Either way, a new all time closing higher for NEM would be long term bullish for both the stock and gold.
On December 1 New York spot gold closed at $502.30, slightly exceeding a target long awaited by gold bugs, but $500 is also a level we technicians have for a long time identified as a long-term resistance level. Could it be that the cyclical bull market in gold has come to an end?
Strictly speaking, we can't say for sure that the secular bear market in gold is actually over yet. As you can see by the chart, gold has more or less maintained a trading range since 1983, whereby it worked off the excesses of the prior bull market that took prices to $850. So far it has not decisively broken out of that trading range, therefore, we cannot conclude that the long-term consolidation is over.
Nevertheless, I believe that the bear market low was made in 1999, and that the rally from the 2001 retest low is the beginning of a secular bull market; however, it is still likely to take some time before gold can move significantly higher and put the trading range behind.
The rising trend channel I have drawn on the chart reinforces the overhead resistance and offers some perspective regarding the ebb and flow of prices. While the bull market is likely to continue, it is also likely that prices will soon pull back and consolidate. This process could take up to a year or more with correction lows around $450. I also think we could see prices as high as $530 before the correction starts.
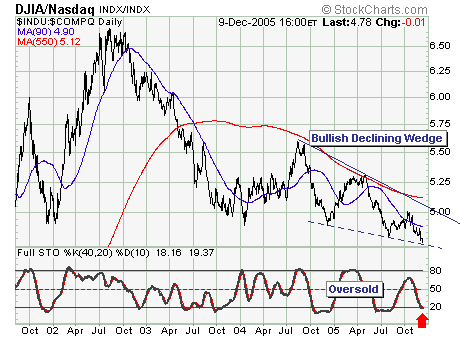
The December to mid-January time frame has produced a number of rather large and tradable tops throughout history; and it is our belief the probability favors just such a top developing given the current overbought momentum readings. That said, we also note that the declining Dow Industrials-Nasdaq Composite Ratio is forming a bullish declining wedge; this is important from the standpoint of “intra-group rotation”, for generally this ratio tends to rise as the broader market declines. Hence, the risk-reward dynamic suggests we want to be relative bullish of the more prosaic industrial shares, while being short of technology in a hedged portfolio. Aggressive traders can simply “rotate” into an overweight short position via technology shares.