Things are jumping here at StockCharts. With the upcoming release of the next version of our main charting tool, I've been way too busy to watch the market closely. Fortunately, our crack team of market commentators has been on the case and you can find their bi-weekly dispatches below.
For those of you that have been sending us feedback on SharpCharts2, thanks! We've received over 400 messages from users about the most recent release - most of them very positive. People seem to love the ability to overlay anything on top of any other thing and the ability to have more than one stock on the same chart. If you haven't had a chance to check out SharpCharts2, what are you waiting for? Our current Beta version is open to everyone. Just be sure to read the Release Notes first!
Here's just a sample of the kind of charts that SharpCharts2 can create:
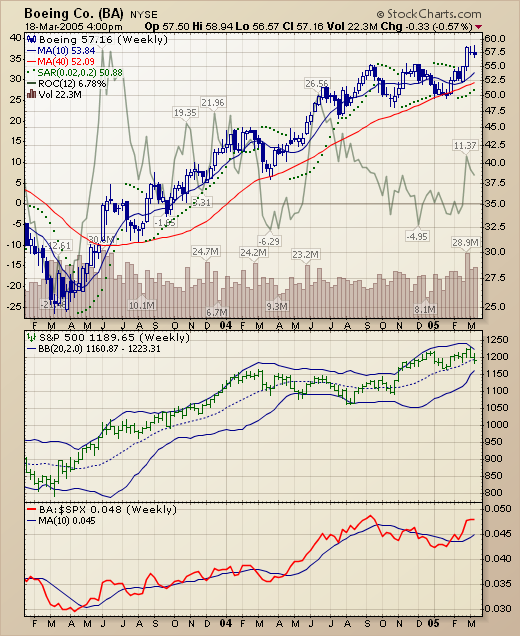
Chart 1
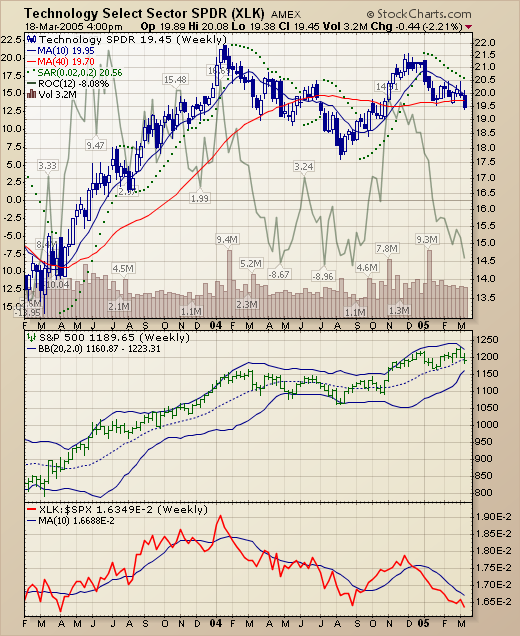
Chart 2
The first chart shows that Boeing (BA)has actually been outperforming the S&P 500 for some time now which the Technology sector (XLK in the second chart) hasn't been doing as well. (See the difference in the faded-green ROC lines and in the red ratio lines?)
The key thing these charts show are new features like:
- Value Labels on volume bars
- Control over the color of candles and bars
- Multiple datasets on one chart
- Custom overlays for indicators (the 40-week MA on the ratio chart)
- Custom indicator colors (the green ratio line)
- Multiple date/time axes
- Indicators placed behind the main chart (the ROC)
- Transparent indicators (the ROC)
- Candlesticks and OHLC bars on the same chart.
- and Value Labels on overlaid indicators (the ROC)
Whew! That's a lot of power in one charting tool! Can you handle it? Keep in mind that since this is still a Beta release, it still has bugs and that's what we are asking for help with. First, read the Release Notes, then, if you still have questions, you can use the "Report Problems" and "Discuss" links below any SC2 chart to tell us about any problems you encounter. Just click here to get started...
Now, on with the market commentary!
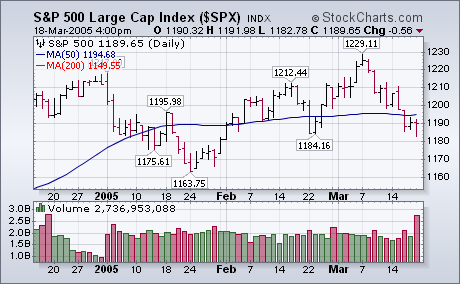
Most of the major market averages closed in the red today, but only marginally. After trading down most of the day, the S&P 500 closed with a loss of less than a point. The S&P also held at its late February low at 1184. While the price action was relatively tame, volume was heavy. Don't pay too much attention to that however. Friday was a triple witching day which often produces heavier trading. The S&P also underwent some "rebalancing" in its stock weightings to ensure that only publicly traded shares are counted in a stock's capitalization. That means that some shares will have a bigger weighting and others a smaller. That also contributed to today's heavy volume. I wouldn't read much into it or today's price action. Despite today's late bounce, the market still looks toppy to me for reasons that I've already spelled out in previous messages.
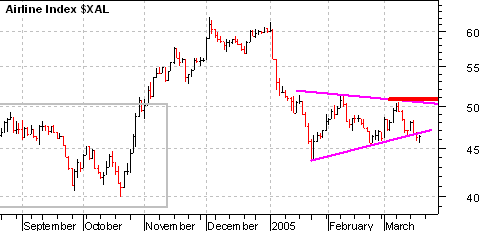
With the surge in oil prices over the last three months, the Amex Airline Index (XAL) remains under pressure. After a sharp decline in January, the index consolidated with a symmetrical triangle. The recent break below the lower trendline is certainly negative and further weakness below the February low (45) would signal a continuation of the January decline. Should the index hold support, look for a move above the early March high to signal that airlines are ready to fly again.
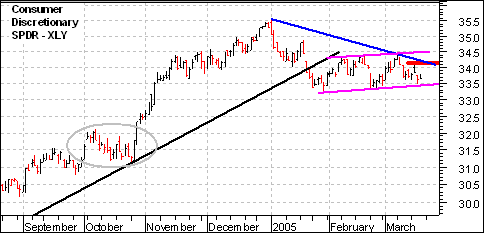
In an interesting and telling twist, the chart for XAL looks similar to the Consumer Discretionary SPDR (XLY) chart. Part of the reason these charts are similar is because their businesses are cyclical and dependent on the economic cycle. Both show sharp January declines followed by consolidations. Because consolidations are continuation patterns, a consolidation after a decline is typically bearish and traders should prepare accordingly.
The title of this article, Looking for a CRB Top , has been my broken record for the last year or so, but it just hasn't happened so far.
I use the monthly price chart and PMO ( Price Momentum Oscillator ) to determine when long-term price reversals may be approaching. Last year it looked like a top was forming as the PMO topped twice and prices stalled in the congestion area between about 260 and 285, but this activity proved to be a consolidation that built compression for the most recent rally.
This rally has been virtually straight up. It has broken through the top of the rising trend channel and is close to challenging the 1980 high of 337.60, which is a long-term resistance level. However, evidence of an approaching top is mounting. Sentiment on commodities is very bullish. The PMO is very overbought and approaching the record level of 1980. The recent vertical price advance creates vulnerability for a vertical decline, prior evidence of which you can see on the chart. Finally, the long-term overhead resistance looks like a good place for prices to stall.
While my CRB market posture is bullish based upon a shorter-term trend following model, I think the three-year CRB rally has nearly run its course.
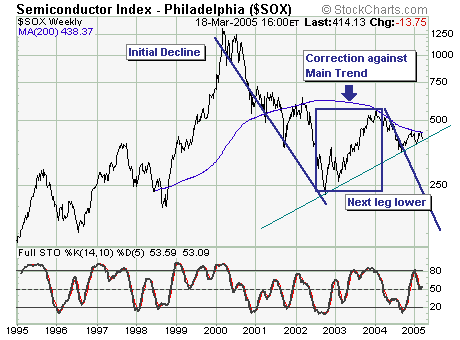
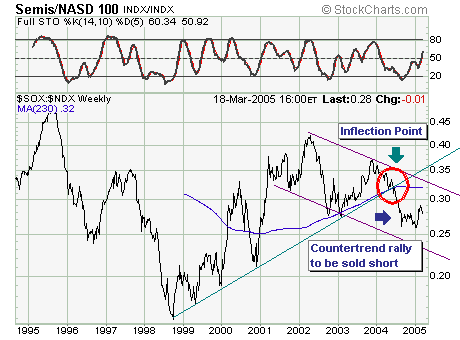
Today we expand a bit with 2 charts; with our contention that selling short the Semiconductor Index ($SOX) and several individual names has a high probability of success in the months ahead.
Looking at the $SOX, it is trading within a not yet complete' decline that began in 2000, of which the recent correction higher is complete given multiple failure' at the 200-week moving average. This absolute negative when coupled with emerging relative underperformance by the $SOX with the Nasdaq 100 ($NDX) [chart 2] indicates shares are headed lower...and for those wanting to add high beta' to their short portfolios may decide this sector warrants and overweight trading position'.
Our favorites are in the semiconductor and semi capital equipment maker industries : Xilinix (XLNX), BroadCom (BRCM), KLA Tencor (KLAC) and Novellus (NVLS).