The market finished last week with three big down days. So far this year, the Nasdaq is down 6.5%. Much of the fall has been driven by Small Cap stocks as the S&P 500 Large Caps is only down 3.6% during the same period. As John Murphy subscribers already know, the Technology sector has been the weakest so far this year while Energy and Consumer Staples have been the strongest.
Speaking of John Murphy, this edition of the newsletter kicks off with a great educational piece on moving averages from John. Richard Rhodes then shows us why January's decline is becoming increasingly important. Carl Swenlin sees reasons for optimism in the OEX Put/Call ratio. And finally Arthur Hill looks to the Retail and Semiconductor sectors for relief.
Let's dive right in...
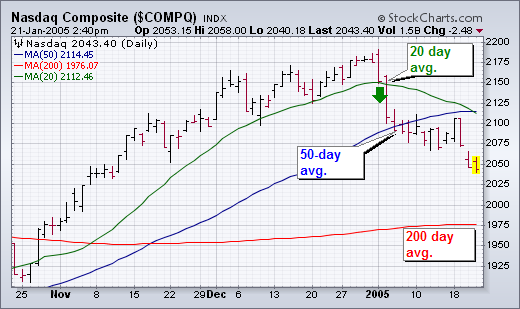
The 20-day average is usually too short for my purposes which is to spot bigger trend changes (although it is the period used in Bollinger Bands). At the same time, the 200-day average is too long. Imagine holding a long position in the market waiting to see if it breaks the 200-day average. The chart below shows that the Nasdaq would have to drop more than 200 points (10%) to give a sell signal. That's too much to give up in my opinion. That's why I rely most heavily on the 50-day average. One of the simple rules that I follow is to require that any sector, industry group, or stock that I'm recommending close over its 50-day average. At the same time, I consider selling anything that closes under its 50-day line. There are some conditions that I look for to confirm a downside break. The market has to "close" beneath the 50-day line and in decisive fashion. Then it has to "stay" under it. Very often a market will attempt to climb back over its 50-day line. If it fails that attempt, that's another bearish sign. I also watch the "Friday" close. That's because a Friday close determines where a market ends on a weekly bar chart. [On a weekly chart, the 50-day average is converted to a 10-week average]. A Friday close beneath a moving average is more serious than a mid-week violation. That's even more true of the 200-day (or 40-week) moving average. In the chart below, the Nasdaq closed under its 50-day line on Wednesday, January 5 and remained beneath it through the end of the week. It never did close back above it. That's negative action -- and a pretty good reason to have considered doing some selling of longs (or initiating new shorts).
January and 2005 have not been good for the bulls. After a strong finish in 2004, stocks were hit with strong selling pressure to begin the year and have yet to recover. A look into November and December reveals early weakness in two key groups. More importantly, traders can turn to these two key groups for signs of a bullish revival.
So who done it? Look no further than Retail and Semiconductors. The retail group makes up a big part of the Consumer Discretionary sector and influences the S&P 500. In addition, estimates are that retail spending drives 2/3 of GDP and exerts a large influence on the economy. Semiconductors represent a key tech group that influences the Nasdaq, which in turn affects the S&P 500.
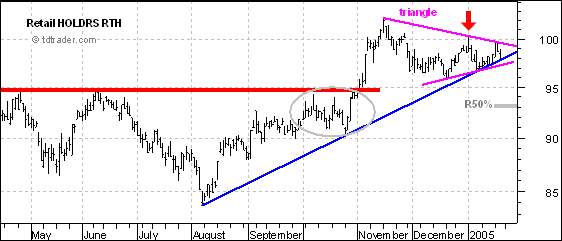
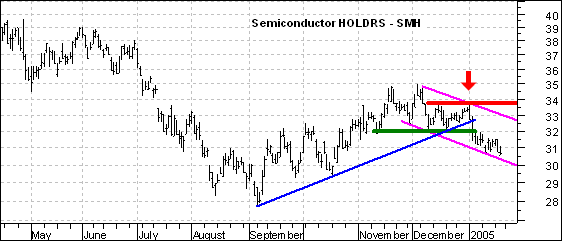
Both stocks were keeping pace until mid November and then started underperforming in December. While the S&P 500 and Nasdaq finished 2004 near their highs for the year, the Retail HOLDRS (RTH) and the Semiconductor HOLDRS (SMH) failed to exceed their November highs (red arrows) and began underperforming.
SMH went on to break the blue trendline and key support at 32 for a bearish signal, while RTH formed a triangle over the last two months. Both need to move above their 3-January highs to put the bulls back in charge. The pattern for SMH looks like a falling price channel (magenta trendlines), but the channel is still falling and it would take a move above key resistance at 33.77 to forge a significant breakout. For RTH, a move above 100.25 would signal a continuation higher. As long as these early January highs hold for both, the broader market is likely to remain under pressure.
The Equity and OEX Put/Call Ratios generally signal overbought and oversold conditions that help identify price tops and bottoms; however, sometimes the OEX Put/Call Ratio will invert relative to the Equity Put/Call Ratio. At these times the inversion signals the opposite of what we would normally expect.
Here's how I think this works. The Equity P/C Ratio represents the activity of speculators (the little guys) who become more and more committed to price direction until it reverses on them, therefore the Equity P/C Ratio becomes oversold at price bottoms and overbought at price tops.
The OEX P/C Ratio reflects hedging activity by big money. These guys tend to lighten up as the price trend becomes more extreme, preparing for the inevitable reversal, so the OEX P/C Ratio can become overbought at bottoms and oversold at tops -- the opposite of what happens to the Equity P/C Ratio.
This is not always the case, but I have put red dotted lines on the chart to point out where these inversions have signaled price bottoms. Note that there is one very prominent inversion occurring now. Because the Equity P/C Ratio is oversold and prices have been declining, I think there is an excellent chance that the OEX P/C inversion is telling us that a price low is imminent.
My observation is that these signals can have short-term or intermediate-term implications, but there is no way to tell in advance.
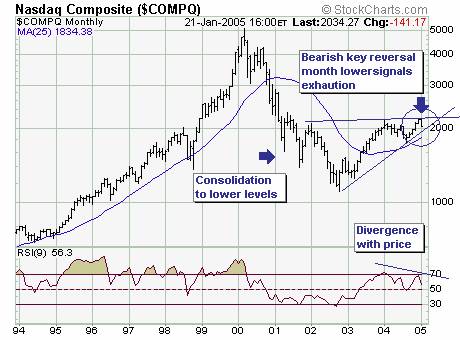
The January decline to date is gaining in importance; if prices remain at current to lower levels through the next six trading sessions then a bearish key reversal month' will form. This would signal exhaustion' of the uptrend, with any and all rallies considered selling opportunities. The last such monthly formation signal was January-2002with the decline of nearly 50% materializing from January's high at 2098 to October's low at 1108. Now, we don't necessarily believe the decline is going to be this dramatic at this time, but we simply want to illustrate that a substantial decline is a higher probability eventeven more so if the 25-week moving average currently at 1834 level is violated.