Market Recap for Wednesday, May 22, 2019
Our major indices finished with losses on Wednesday, despite strength in defensive sectors. The S&P 500 and Dow Jones held up best, falling just 0.28% and 0.39%, respectively. The primary reason is that more defensive stocks are represented on those two indices. Defensive sectors actually performed quite well yesterday with utilities (XLU, +0.75%), healthcare (XLV, +0.57%), real estate (XLRE, +0.47%), and consumer staples (XLP, +0.45%) all gaining. If you were seeking relative strength, you needed to be in those areas. The remaining 7 sectors finished in negative territory, led by a very weak energy group (XLE, -1.55%). Crude oil ($WTIC, -2.71%) had a rough day and is threatening a breakdown:
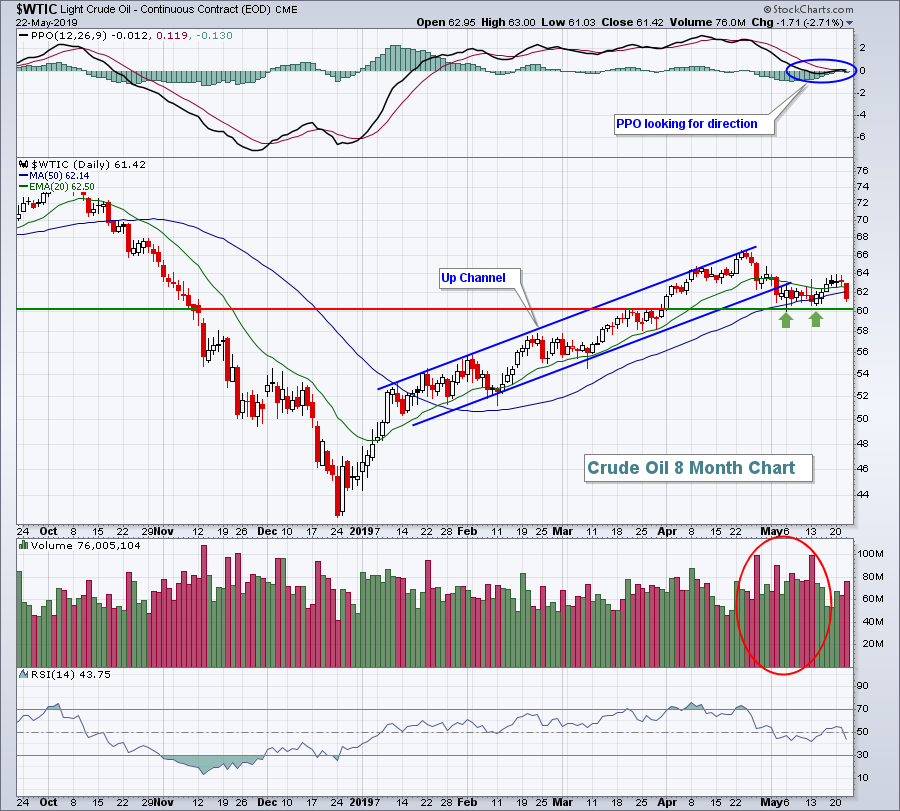 There are a couple of possibilities here to consider from a bullish perspective. Following the up channel, we could simply be consolidating in sideways fashion, awaiting another breakout. That's what the PPO is saying as there's currently no momentum in either direction. If we do begin tracking higher again, perhaps we'll see a cup with handle pattern form - another bullish pattern. But, if we fail at $60 per barrel, all bets are off here. The U.S. Dollar Index ($USD) has been strong and has already put considerable pressure on the relative strength of energy (and materials). A breakdown in crude oil prices would be a dagger for energy bulls so be careful here.
Nordstroms (JWN, -9.25%) and Urban Outfitters (URBN, -9.85%), two awful relative performers in the apparel retail ($DJUSRA, -3.29%), posted quarterly results that did not impress traders one bit. Relative strength definitely predicted these horrible results. I feature this group in the Sector/Industry Watch section below - check it out. Home improvement retailers ($DJUSHI, -4.37%) also suffered after an uninspiring quarterly report from Lowes Cos (LOW, -11.85%).
In a repeat of recent history, computer hardware ($DJUSCR, -2.15%) and semiconductors ($DJUSSC, -2.02%) led the technology group (XLK, -0.52%) lower. QUALCOMM (QCOM, -10.86%), in particular, was crushed. In addition to the ongoing trade war and possible blacklisting of additional Chinese companies, QCOM was hit after a District Judge ruled against the company in an antitrust case. It's been a wild 5-6 weeks for QCOM, beginning with the bullish settlement of its long-term legal battle with Apple, Inc. (AAPL). Yesterday, however, the bulls were on the wrong side of the action.
Pre-Market Action
In a big development, the 10 year treasury yield ($TNX) has fallen 3 basis points this morning to a major support level at 2.36%. It will be very interesting to see what the bond market does at this area of support. A breakdown suggests more money moving to safety, which could be a harbinger of more weakness in U.S. equities near-term.
Crude oil ($WTIC) is down another $1.37, or 2.23%, to nearly $60 per barrel. That's a significant short-term level as illustrated in the Market Recap section above.
Asian markets were lower overnight with China's Shanghai Composite ($SSEC, -1.36%). It closed almost squarely on the support established during the second week of May on the SSEC's initial plunge lower. Further weakness could trigger a much bigger slide so all eyes will be on China again tonight.
European markets are also lower with the German DAX ($DAX) down 1.55%. Dow Jones futures are suggesting a weak open, down 223 points with less than 30 minutes to the opening bell. Strap on your seat belts again.
Current Outlook
I'm bullish in the big picture, but we must respect the short-term technical failures - especially during this period of May, which has historically been bearish. The daily chart on the NASDAQ shows recent failures to clear its downtrending 20 day EMA and we just printed a death cross (20 day EMA moving below 50 day SMA):
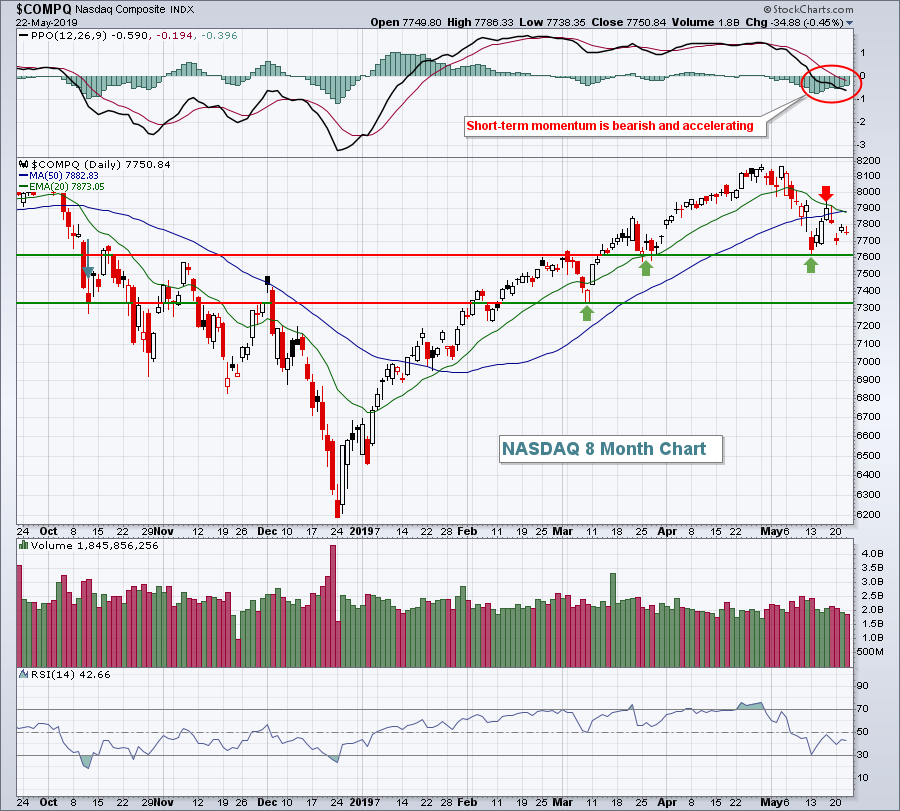 Trying to catch a bottom during a downtrend can be difficult at times, so if you try I'd simply remember to keep a tight stop in place. 7600 would be an initial area to look for a reversal since it's held twice before. I do feel those March lows are very important because they were accompanied by high Volatility Index ($VIX) levels. High VIX readings normally mark significant bottoms on our major indices.
Sector/Industry Watch
The Dow Jones U.S. Apparel Retailers Index ($DJUSRA, -3.29%) had yet another brutal day on Wednesday, closing at their lowest level since mid-January. The trade war and poor earnings provided a 1-2 punch for the bears and they were in control of this group throughout the session. With a trend that is clearly down and beneath the declining 20 day EMA, it's definitely the right time to be on the sidelines with respect to the group:
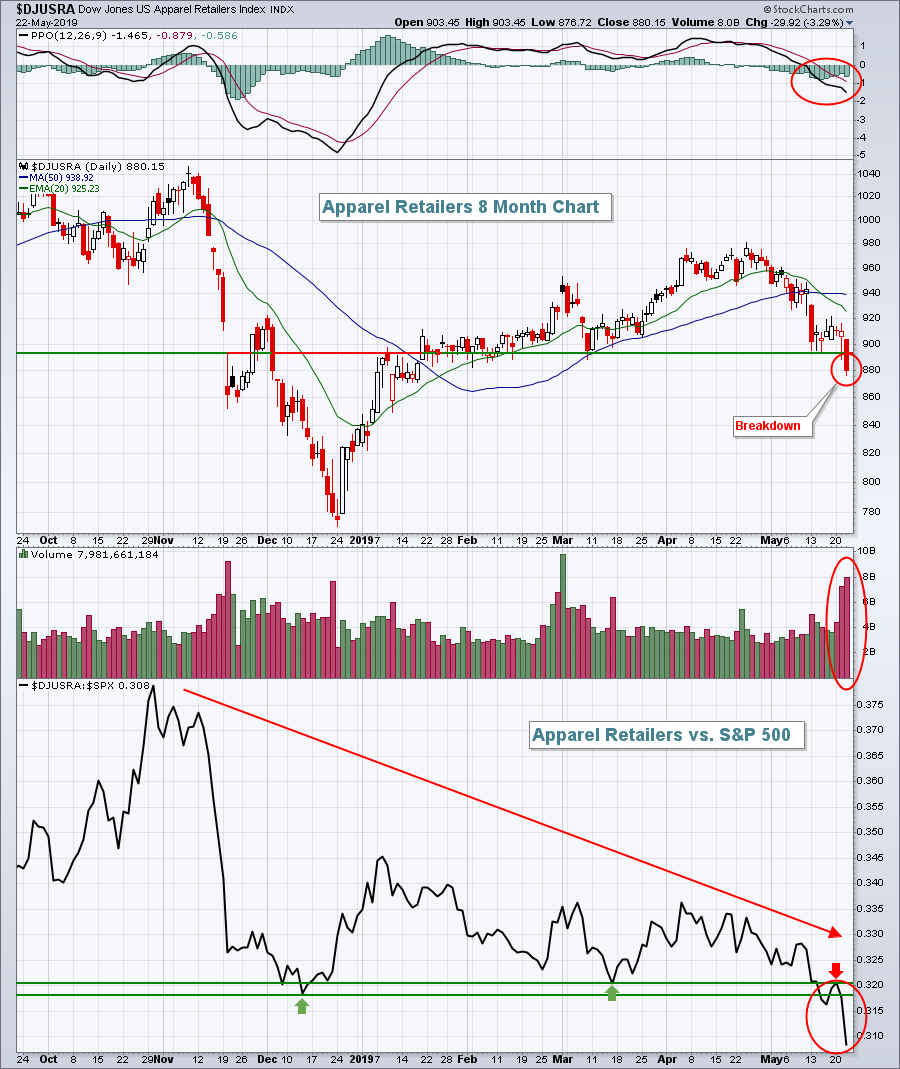 I wouldn't try to be a hero and call a bottom. Wait until the chart and relative strength turn.
Historical Tendencies
I've highlighted recently the seasonal tendency for the small cap Russell 2000 ($RUT) to outperform the benchmark S&P 500 ($SPX) during June. The relative strength has been quite staggering over the past two decades with the RUT outperforming the SPX by an average of 1.6% in June alone.
Well, that relative strength actually begins with the bullish historical period that starts next week. The RUT has produced annualized returns of +65.41% from May 26th through June 5th over the last 32 years.
Key Earnings Reports
(actual vs. estimate):
BBY: 1.02 vs .88
BJ: .26 vs .25
HRL: .46 vs .45
MDT: 1.54 vs 1.46
RY: 1.67 vs 1.63
TD: 1.31 vs 1.25
WB: .56 vs .55
(reports after close, estimate provided):
ADSK: .47
DECK: .10
DXC: 2.07
HPE: .36
HPQ: .51
INTU: 5.39
ROST: 1.12
SPLK: (.15)
Key Economic Reports
Initial jobless claims released at 8:30am EST: 211,000 (actual) vs. 215,000 (estimate)
May PMI composite flash to be released at 9:45am EST: 52.4 (estimate)
April new home sales to be released at 10:00am EST: 680,000 (estimate)
Happy trading!
Tom
