Market Recap for Wednesday, February 13, 2019
The stock market is beginning to exhibit a bit of the borishness that accompanies bull market advances. The Volatility Index ($VIX) remaining below 16 is confirming the reduced level of fear. There were certainly swings intraday yesterday, but the panicked, impulsive-type selling appears to have dissipated, which is bad news for the bears. At the close yesterday, all of our major indices finished fractionally higher, led by the Dow Jones' rise of 0.46%.
The headline news continues to be mostly mixed earnings, but there's growing optimism in the background that a US-China trade deal could be looming. That seems to keep buyers interested, at least for now.
Among sectors, energy (XLE, +1.25%) took its turn atop the leaderboard, while consumer discretionary (XLY, +0.68%), real estate (XLRE, +0.67%), and industrials (XLI, +0.59%) also finished with nice gains. Hotels ($DJUSLG, +3.47%) were quite strong just one day after I wrote about that group showing improvement. Here is the current chart:
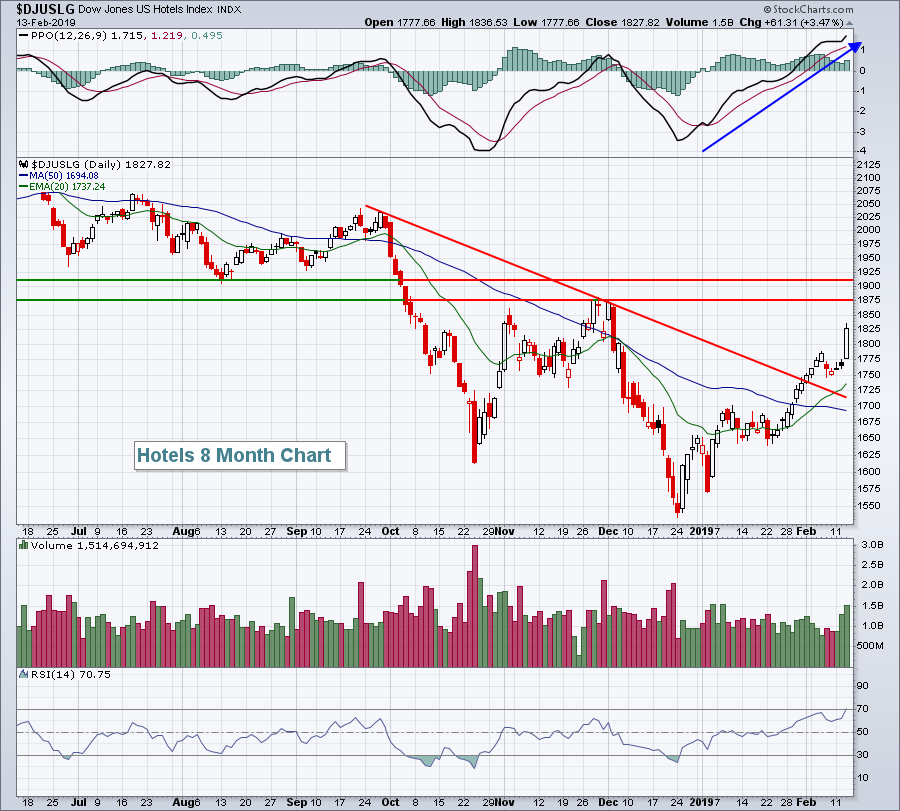 I expect further strength in the DJUSLG, but overhead resistance from 1875-1910 could pose short-term head winds. I found it encouraging that Wyndham Hotel & Resorts (WH, -0.68%) gapped higher and held up fairly well despite a disappointing quarterly earnings report. It could be yet another signal that the worst is behind this group.
Utilities (XLU, -0.29%) was the lone sector in negative territory, no doubt suffering somewhat from the recent rise in treasury yields.
Pre-Market Action
Weaker-than-expected retail sales for December cut into U.S. futures, which were higher prior to the report. Currently, U.S. futures are flat with roughly 30 minutes to the opening bell.
Elsewhere, stocks were slightly lower overnight in Asia, while mostly higher in Europe this morning. The 10 year treasury yield ($TNX) has tumbled 6 basis points to 2.65% on the retail sales news.
Current Outlook
Small caps have been quite strong and have pushed to a 10 week relative high vs. the benchmark S&P 500. Relative strength in small caps is typically a bullish signal for the stock market as it suggests we're in a "risk on" environment. Though certainly not a guarantee for higher prices down the road, it definitely adds an element of bullishness to see these domestic-oriented businesses outperforming:
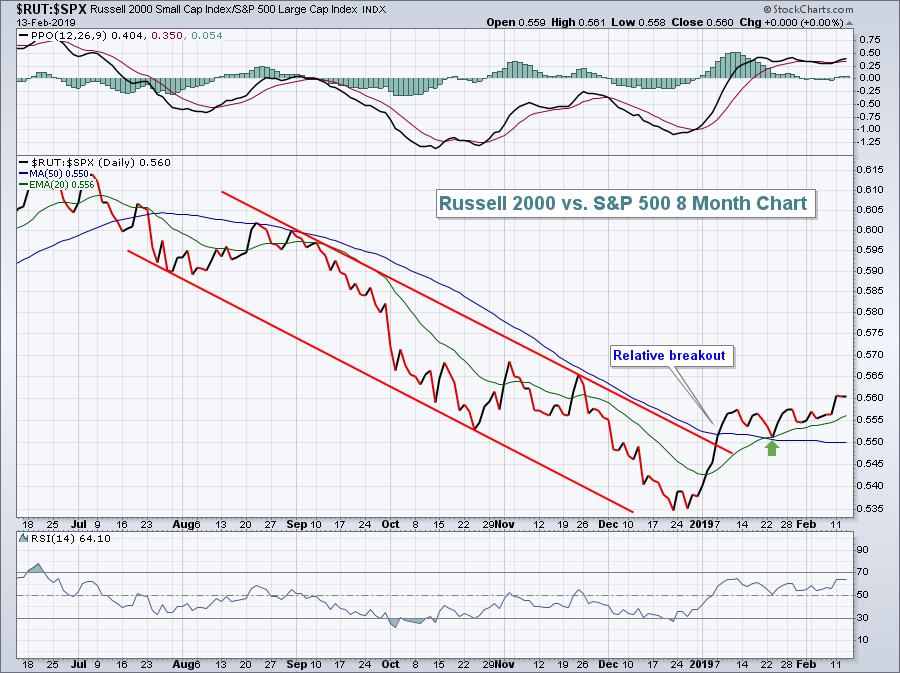 During the second half of 2018, the RUT:SPX relative line stayed primarily beneath the 20 day EMA, highlighting the downtrend. Notice that the green arrow above marks short-term relative support at that now-rising 20 day EMA. For now, small caps remain the better option compared to its larger cap brethren and if you scroll down to the Historical Tendencies section, you'll see that small caps historically outperform the S&P 500 from February through June. It's certainly something to consider in your investing/trading strategy.
Sector/Industry Watch
Consumer discretionary (XLY) remains one of my favorite places to trade and another industry group within this sector made a key breakout on Wednesday. This time it was the home improvements group ($DJUSHI, +1.67%), clearing its reaction price high from early November:
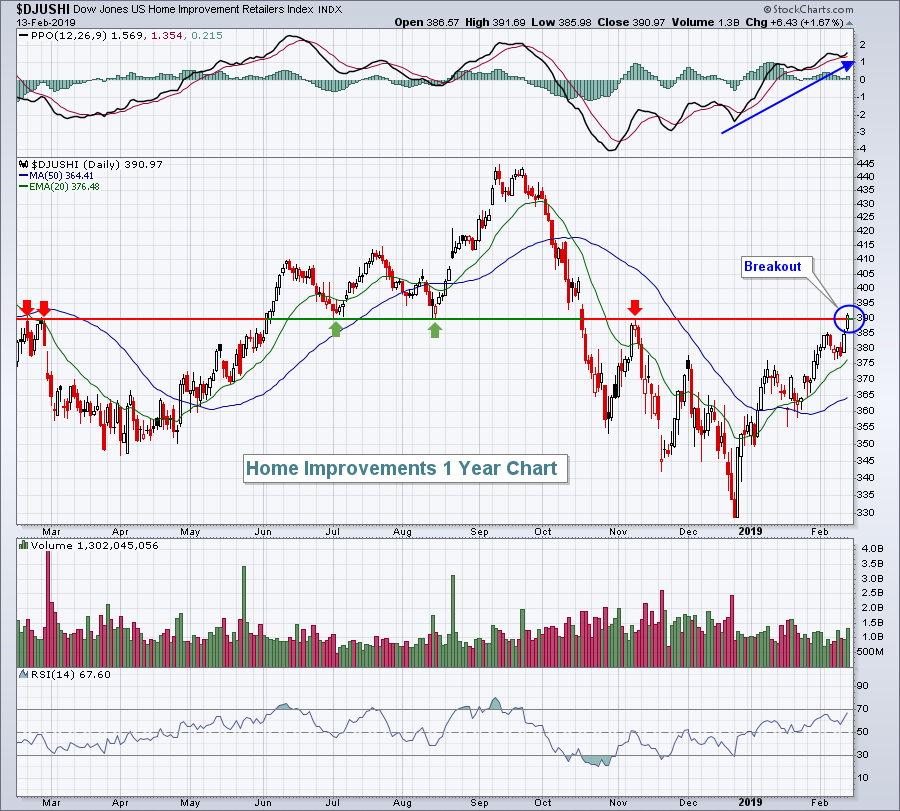 The blue directional line shows the PPO crossing centerline resistance and bullish momentum accelerating. That accompanies the price breakout, a very bullish combination. To the downside, I'm fine so long as the rising 20 day EMA holds as support. There'll be some gap resistance close to 403 from the mid-October gap down, but otherwise I expect to see continuing strength here.
Historical Tendencies
We're in the midst of a very strong seasonal period for small cap stocks, especially vs. the larger S&P 500 companies. The following is a relative chart that illustrates how small caps perform on a calendar month basis, on average, relative to the S&P 500:
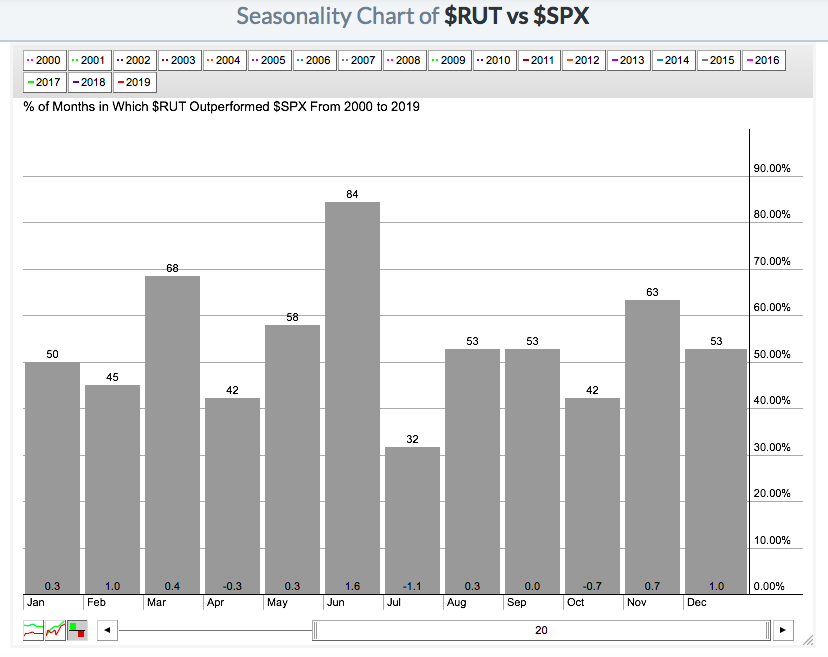 If you add up the average outperformance from February through June, you'll find that over the past 20 years, the Russell 2000 has on average outperformed the S&P 500 by 3 percentage points. That's very substantial over a 5 month period.
Key Earnings Reports
(actual vs. estimate):
AEE: .28 vs .32
AZN: 1.58 vs .73
BWA: 1.21 vs 1.07
CCEP: .62 - estimate, awaiting results
CME: 1.77 vs 1.75
DGX: 1.36 vs 1.36
DUK: .84 vs .89
EPAM: 1.27 vs 1.22
GOOS: .73 vs .58
INCY: .40 vs .43
IQV: 1.50 vs 1.47
IRM: .56 vs .52
KO: .43 vs .43
PPL: .52 vs .49
TRP: .78 vs .70
TRU: .66 vs .63
TU: .53 - estimate, awaiting results
VMC: .99 vs .87
WM: 1.13 vs 1.07
ZBRA: 3.10 vs 2.93
ZTS: .79 vs .77
(reports after close, estimate provided):
AMAT: .79
ANET: 2.04
CBS: 1.53
CGC: (.15)
NVDA: .75
SSNC: .85
XPO: .83
Key Economic Reports
Initial jobless claims released at 8:30am EST: 239,000 (actual) vs. 225,000 (estimate)
January PPI released at 8:30am EST: -0.1% (actual) vs. +0.2% (estimate)
January Core PPI released at 8:30am EST: +0.3% (actual) vs. +0.2% (estimate)
December retail sales released at 8:30am EST: -1.2% (actual) vs. +0.1% (estimate)
December retail sales less autos released at 8:30am EST: -1.8% (actual) vs. +0.0% (estimate)
Happy trading!
Tom
