Market Recap for Monday, December 10, 2018
Yesterday was significant for one very important technical development. The February 2018 low close of 2582 was within a whisker on Monday as the S&P 500 hit an intraday low of 2583 before rallying strongly. Technology (XLK, +1.38%) led the rebound, followed by communication services (XLC, +0.76%) and healthcare (XLV, +0.39%). Energy (XLE, -1.56%) lagged badly, as did financials (XLF, -1.39%). Let's look at that key price support test on the S&P 500:
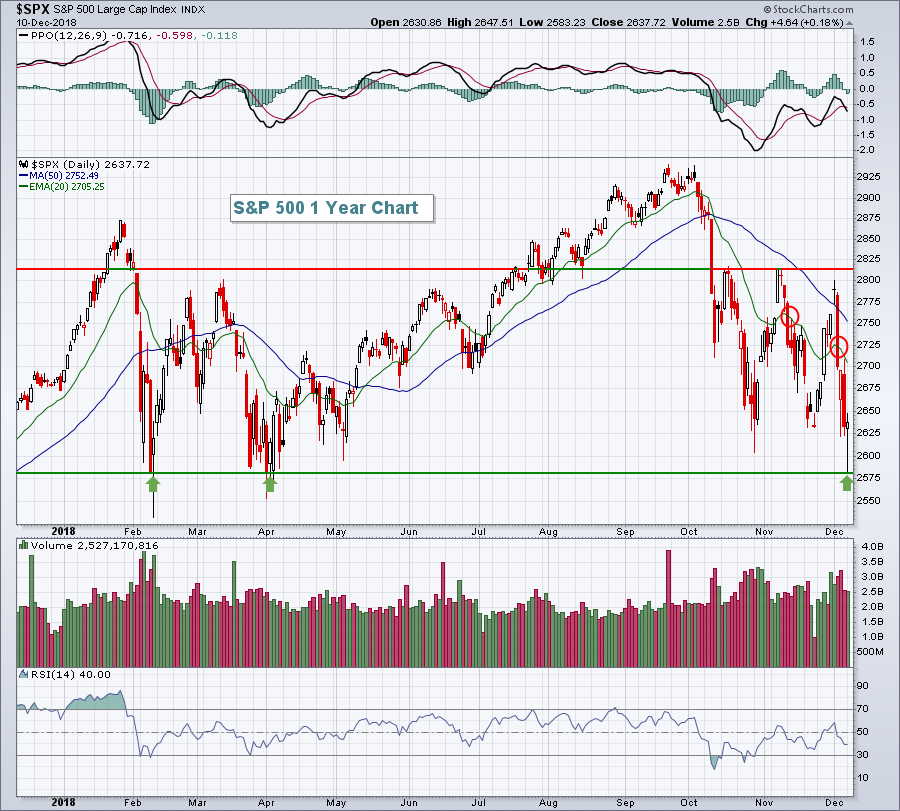 Two things stand out to me. First, the green arrows clearly mark a MAJOR price support level. That horizontal line at 2582 marks the primary difference between a bear market and a correction, in my opinion. You cannot have a bear market without that breakdown. If the breakdown occurs, I'd expect to see a very swift move lower, accompanied by the highest Volatility Index ($VIX) reading of 2018. The VIX yesterday topped in the 26-28 area - exactly where each of our S&P 500 price lows have occurred since the initial push lower in February:
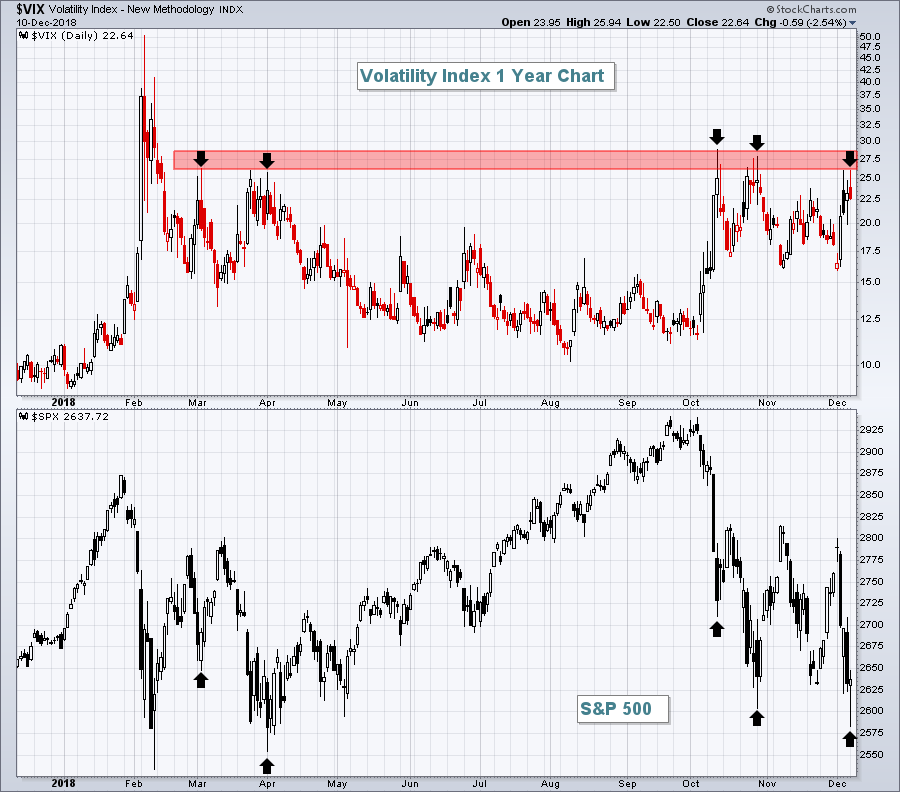 We can talk about sector rotation, volume, PPOs, moving averages, trendlines, blah, blah, blah. The bottom line is this. Is there enough selling and enough money coming out of the market to generate a breakdown in S&P 500 price support at 2582? There wasn't in April. There wasn't in October. And there wasn't yesterday. I suspect that if we see a true breakdown below 2582 and a bear market is underway, we'll see the VIX spike into the 30s, possibly even the 40s. That's what I'll be looking for to confirm the presence of a bear market.
Pre-Market Action
We're still seeing litte in the way of rotation from treasuries to equities and that's going to make an S&P 500 rally more difficult to sustain. At last check this morning, and despite a global equity rally, the 10 year treasury yield ($TNX) has barely budged, gaining only one basis point to 2.87%.
Crude oil ($WTIC) is up 1.53% to $51.78 per barrel, rising along with both Asian and European equity markets, which are mostly higher. Dow Jones futures are currently higher by 305 points as yesterday's reversal appears set to be extended - at least at the open.
Current Outlook
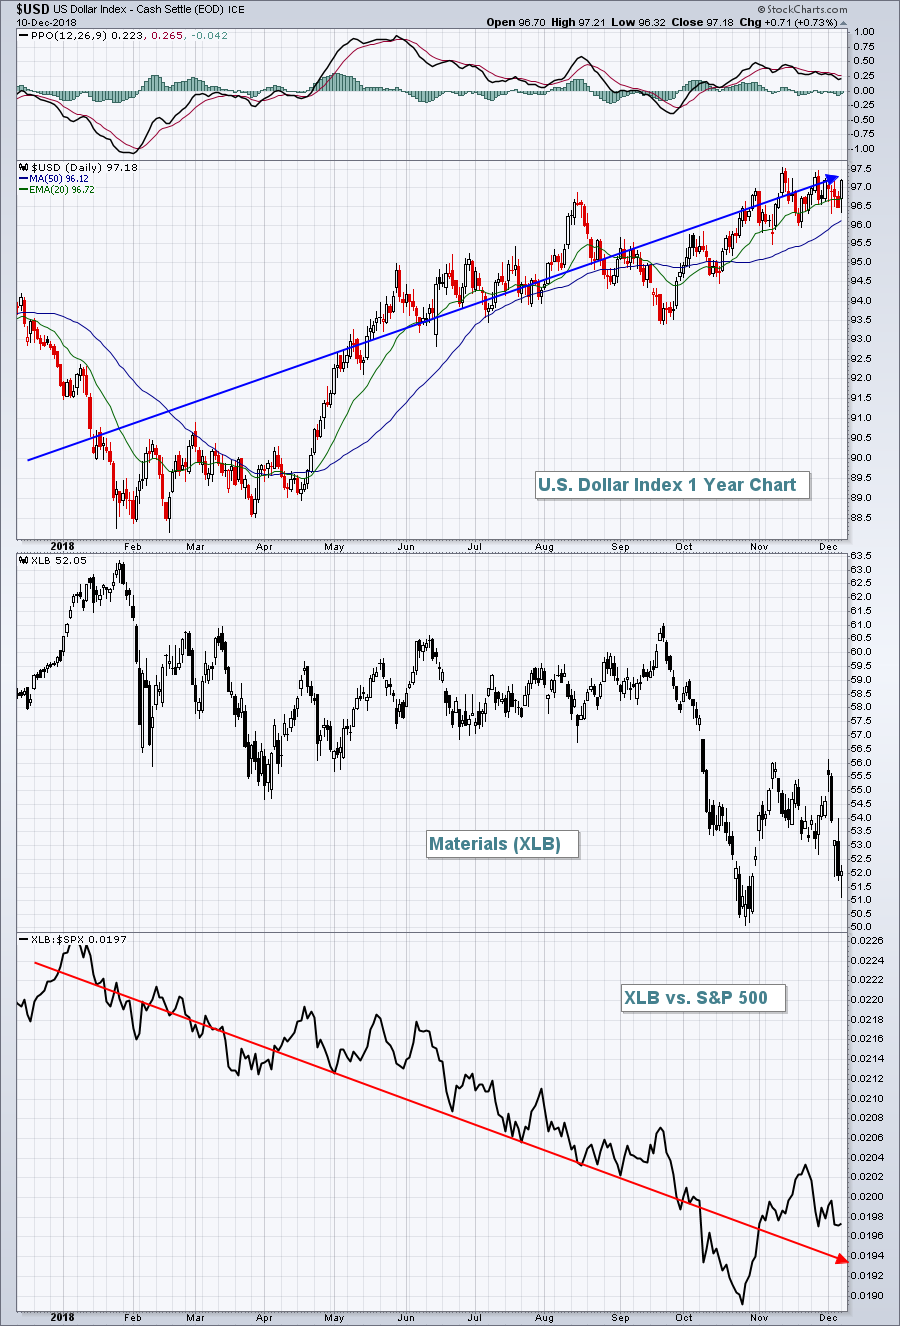
The strong dollar ($USD) continues to keep pressure on basic materials (XLB). This sector faces headwinds from a rising dollar, but benefits from a falling dollar. At this point, the greenback is showing few signs of slowing. As a result, I'd look outside of the materials sector for trade candidates:
 Recently, we've seen strength in gold (GLD) and gold miners ($DJUSPM), but it's difficult to see that continuing if the dollar's trek is higher.
Sector/Industry Watch
Banks ($DJUSBK, -2.28%) were the worst performing financial industry group on Monday, moving well below their 2018 price support. In fact, banks have taken a dramatic turn lower over the past five trading sessions since testing overhead reaction highs established in October and November:
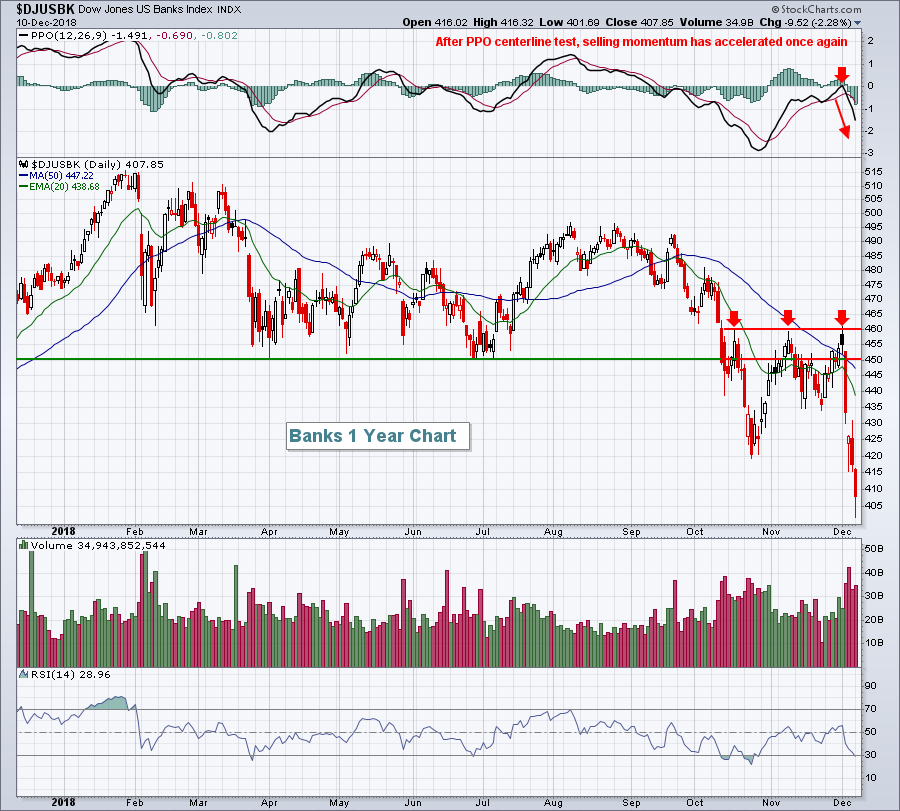 The three red arrows mark multiple tests of 460 price resistance, so clearly that'll be a big hurdle on any future recovery in this space. Volume has been heavy on this selloff as well.
Historical Tendencies
Over the past two decades, materials (XLB) have shown their best relative performance in Q4 where the XLB has averaged outperforming the benchmark S&P 500 by a staggering 3.5 percentage points. In the Current Outlook section above, you can see the XLB:$SPX ratio in 2018 Q4 thus far. There was notable relative strength from late-October through the first few weeks of November, but the ratio is lower today than it was at the start of October. Therefore, the seasonal bullish trend has not held up in 2018 with three weeks left in the quarter.
Key Earnings Reports
(actual vs. estimate):
DSW: .70 vs .53
(reports after close, estimate provided):
AEO: .47
PLAY: .21
PVTL: (.09)
Key Economic Reports
November PPI released at 8:30am EST: +0.1% (actual) vs. +0.0% (estimate)
November Core PPI released at 8:30am EST: +0.3% (actual) vs. +0.1% (estimate)
Happy trading!
Tom
