Market Recap for Tuesday, December 11, 2018
Volatile action on Tuesday resulted in a bifurcated market. The NASDAQ managed to cling to gains at the close, while the Dow Jones, S&P 500 and Russell 2000 saw early morning gains turn into losses by the close. Leadership came mostly from defensive areas of the market as consumer staples (XLP, +0.82%), utilities (XLU, +0.41%), healthcare (XLV, +0.31%) and real estate (XLRE, +0.18%) finished atop the sector leaderboard. Financials (XLF, -0.97%) and industrials (XLI, -0.59%) were the primary laggards. Basic materials (XLB, -0.33%) also struggled as the rising U.S. Dollar Index ($USD, +0.18%) neared its highest level in 18 months, keeping a lid on most materials stocks.
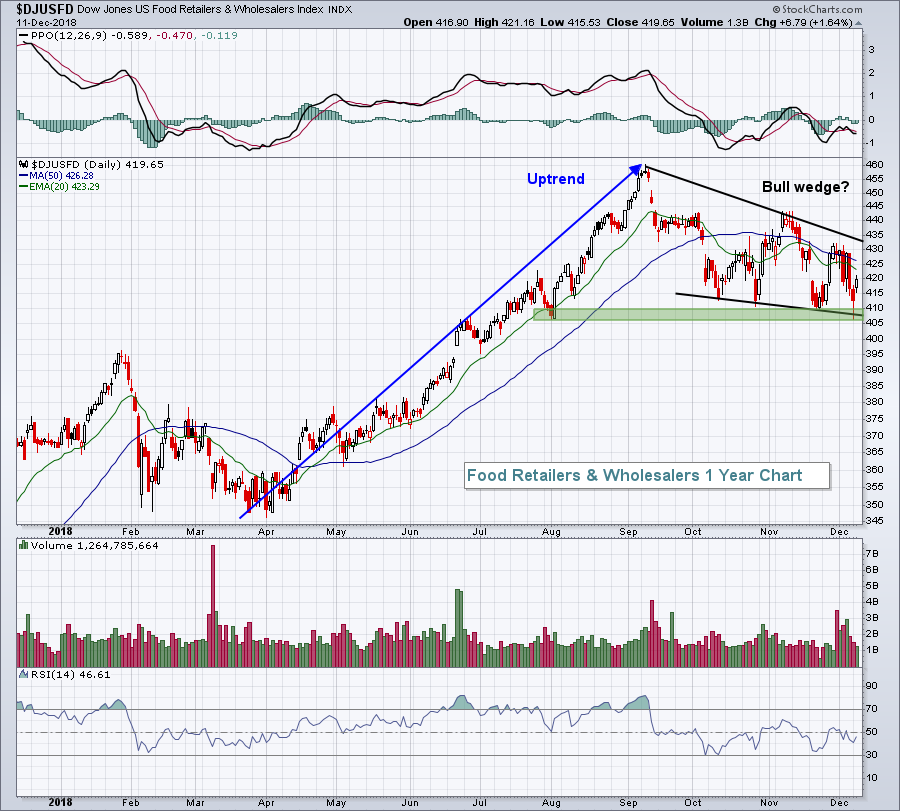
Food retailers & wholesalers ($DJUSFD, +1.64%) performed well in consumer staples, clinging to price support in the 405-410 range while hoping longer-term to break out of a bullish wedge:
 Restaurants & bars ($DJUSRU, -0.84%) had been one of the strongest areas of the market during November, but a negative divergence seems to have slowed the group:
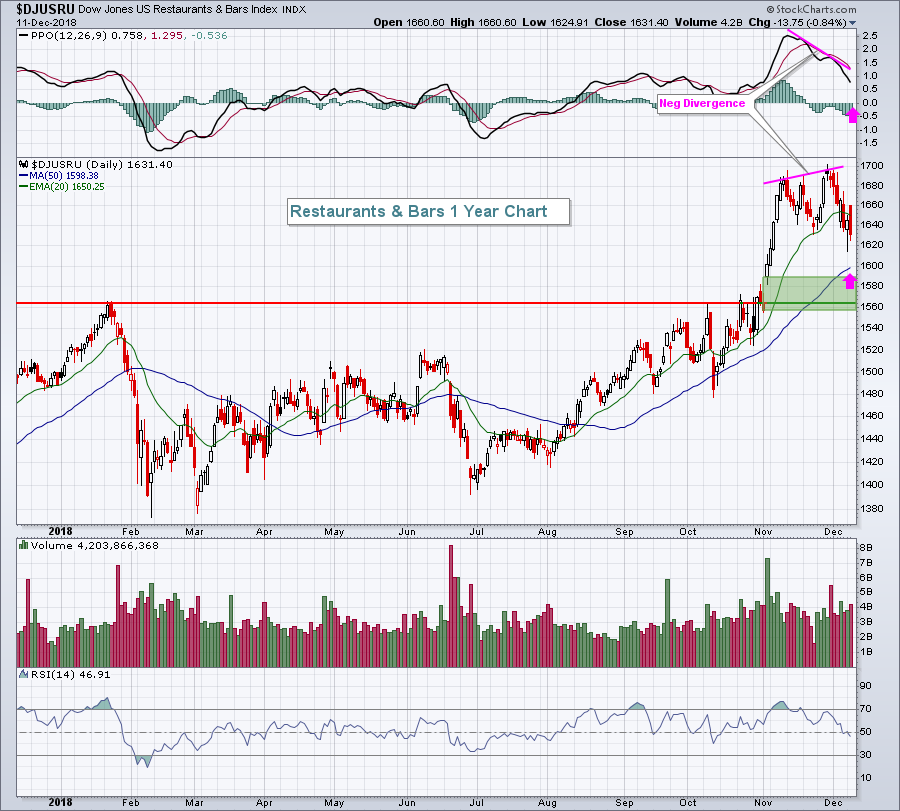 The pink arrows mark PPO centerline and 50 day SMA support that many times are tested after negative divergences emerge. A drop below the 50 day SMA is certainly possible given that key gap and price support reside in the 1560-1590 range.
Pre-Market Action
We've finally begun to see an uptick in treasury yields. Yesterday, the 10 year treasury yield ($TNX) climbed for a second consecutive day, the first time that's happened in six weeks. It wasn't much, but any lift in treasury yields means a rotation away from treasuries - a much-needed ingredient for a short-term stock market rally. This morning, the TNX is up slightly to 2.89% and it's coinciding with higher U.S. futures. Dow Jones futures are higher by 221 points with approximately 45 minutes left to the opening bell.
Current Outlook
As the S&P 500 has consolidated in sideways fashion throughout 2018 with its most recent price support test at 2582 on Monday, its key 20 day and 50 day moving averages have offered little support or resistance - typical technical behavior during trendless, basing periods. Accordingly, I've used hourly charts and 20 hour EMAs as my primary source of short-term support and resistance. Unfortunately, after climbing above the 20 hour EMA on Monday's reversal, the S&P 500 quickly failed to sustain its strength above that moving average. Futures this morning are strong, potentially providing yet another lift above the 20 day EMA:
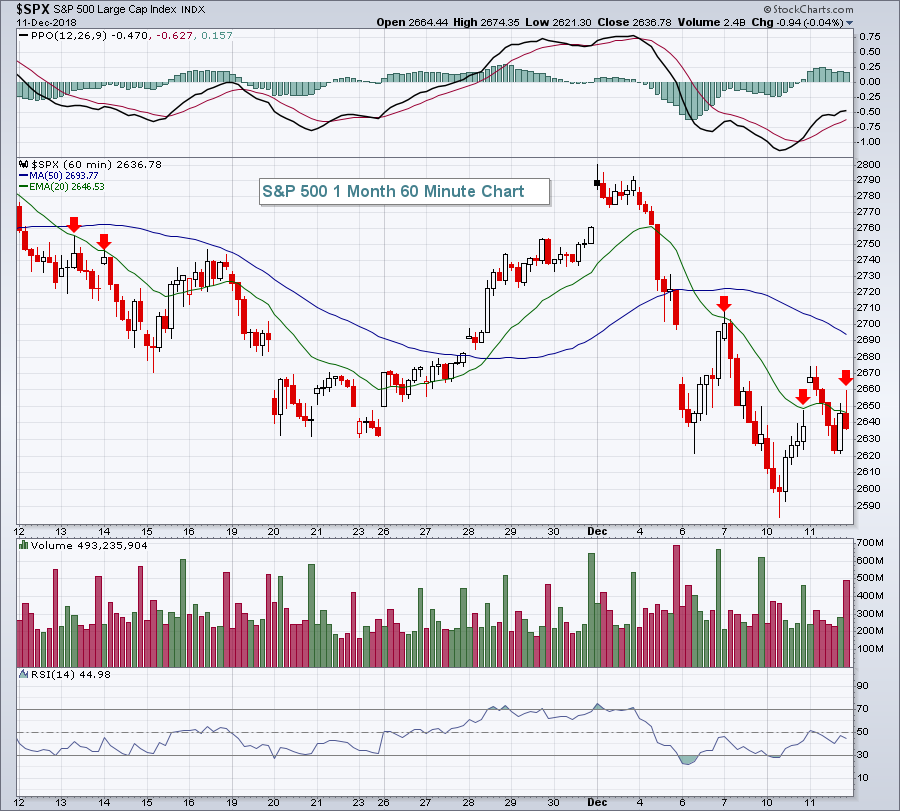 We're likely to pierce the overhead 20 day EMA resistance at today's open, but it's difficult to say whether or not we'll be able to hold above it for any length of time. Just keep in mind that the critical price support level remains 2582. Each of the last two bear markets had critical price support levels, quite similar to the current 2582 level, that gave way and led to much deeper selling.
Sector/Industry Watch
Industrials (XLI) are already painting a rather bearish picture as this influential sector has been underperforming throughout 2018. Its February price support was lost in May, which was then lost again in October. After yesterday's early strength, the XLI retreated and by day's end had set its lowest close of 2018:
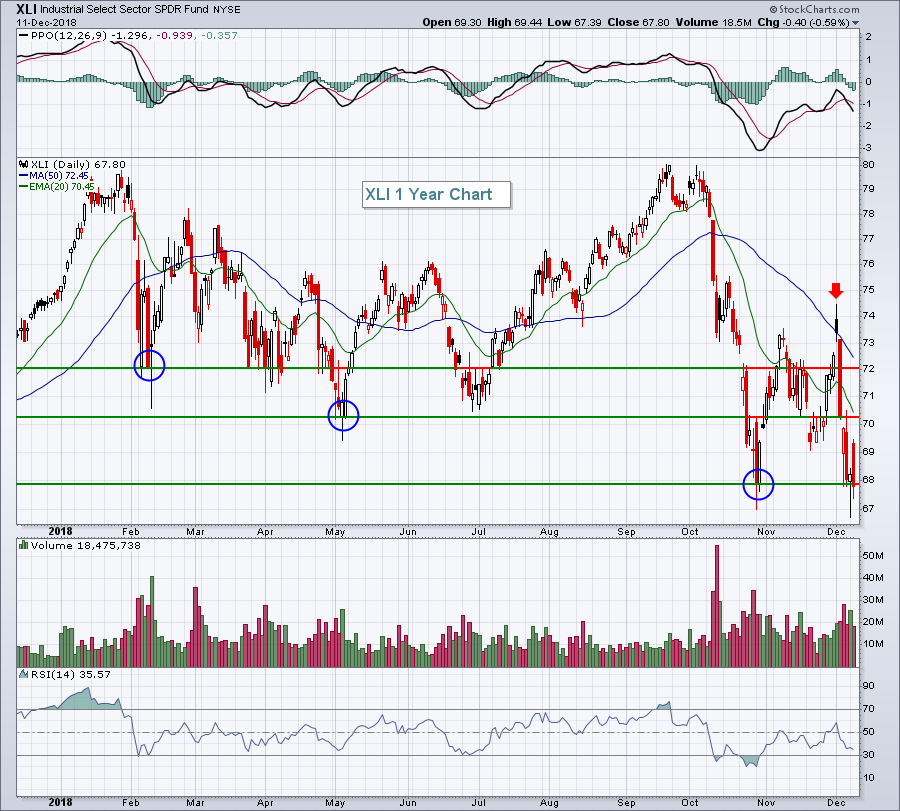 The heavy volume the past 60 days also suggests that investors are bailing on industrials. While bulls could argue for a double bottom in the 67-68 range, that would not be confirmed until the XLI closes back above 74. Since we have yet to see a breakdown in the S&P 500 below 2582, it's still is possible this will all end in bullish fashion, but many signals suggest otherwise. Remain cautious.
Historical Tendencies
Here are the S&P 500 annualized returns for each of the following calendar days since 1950:
December 11 (yesterday): -47.37%
December 12 (today): -14.00%
December 13 (Thursday): -6.29%
December 14 (Friday): -51.65%
Key Earnings Reports
(reports after close, estimate provided):
NDSN: 1.47
Key Economic Reports
November CPI released at 8:30am EST: +0.0% (actual) vs. +0.0% (estimate)
November Core CPI released at 8:30am EST: +0.2% (actual) vs. +0.2% (estimate)
Happy trading!
Tom
