Market Recap for Thursday, December 6, 2018
The Dow Jones and S&P 500 were both on a crash course for key February price support until buyers re-emerged just past 11am EST. At the low yesterday, the Dow Jones was down nearly 800 points and it had tumbled more than 1700 points since the euphoric highs on Monday after the U.S.-China trade war "cease fire" was announced. But the Dow Jones rose 400 points in final 75 minutes of action on Thursday to finish with a meager drop of 79 points. The NASDAQ, meanwhile, erased an earlier 175 point drop to end the session in positive territory, gaining 29 points by the close. This highly volatile environment is resulting in wild swings, although it's important to remember key price levels to both the upside and downside. Here's the latest Dow Jones chart:
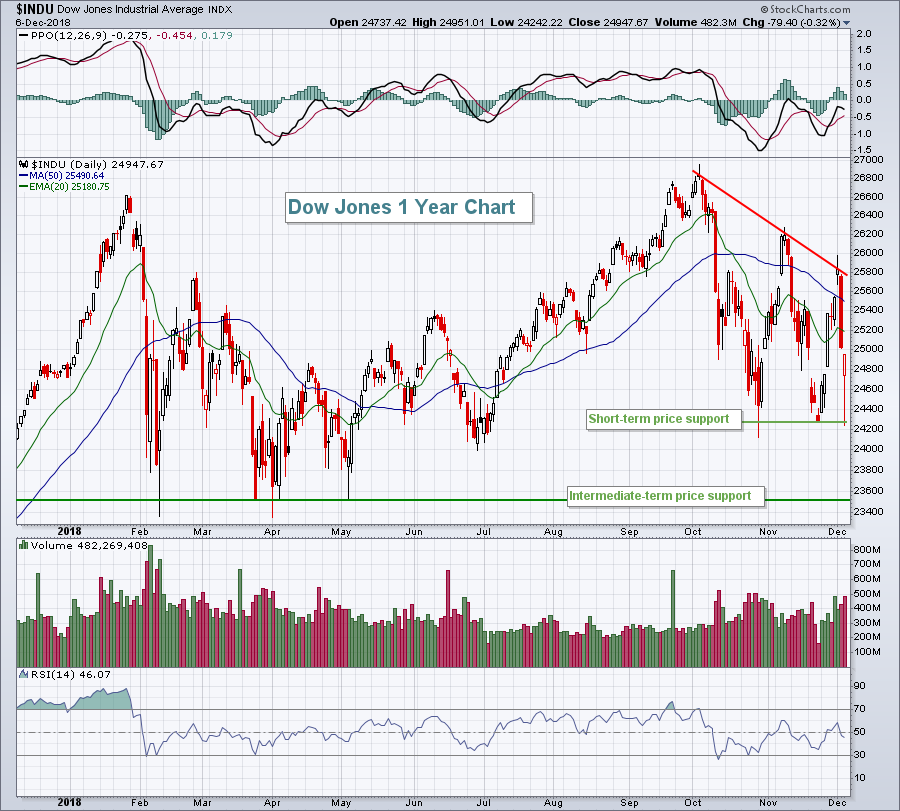 If you look back over the summer months, you'll see an uptrending Dow Jones with rising 20 day EMA support holding throughout. After breaking down in October, though, note that the 20 day EMA and 50 day SMA have done little to stem the tide of buyers or sellers. Moving averages provide support during trends, not periods of consolidation like the one we're currently experiencing.
It's also notable that relative strength yesterday came from the defensive real estate sector (XLRE, +2.74%). Communication services (XLC, +1.12%) and consumer discretionary (XLY, +0.48%) also saw strength, but the day's landscape of winners paints the picture of a mediocre day at best, despite the significant reversal. We're rangebound for now as upcoming action will dictate whether this is the beginning of a bear market or simply another 1+ year correction and basing period similar to 2014-2016.
Pre-Market Action
We're seeing a slight bounce in futures after a weak nonfarm payrolls report for November was released at 8:30am EST this morning. Personally, I didn't like the numbers today so I'll be on the lookout for a possible reversal later today. If the S&P 500 moves up intraday above 2705 and begins to roll over, I'd be very careful with the short-term action. A move above 2705 that holds could signal a more sustainable short-term advance. Of course, one big problem with today's market is that Volatility Index ($VIX) readings in the 20s make it difficult to trust anything you see as bouts of impulsive selling can appear out of nowhere.
Keep stops in place.
Current Outlook
The deterioration of transportation stocks ($TRAN) relative to utilities ($UTIL) suggests that our economy will be slowing. Unfortunately, there's a very strong positive correlation between this TRAN:UTIL ratio and the direction of the S&P 500. Here's the visual:
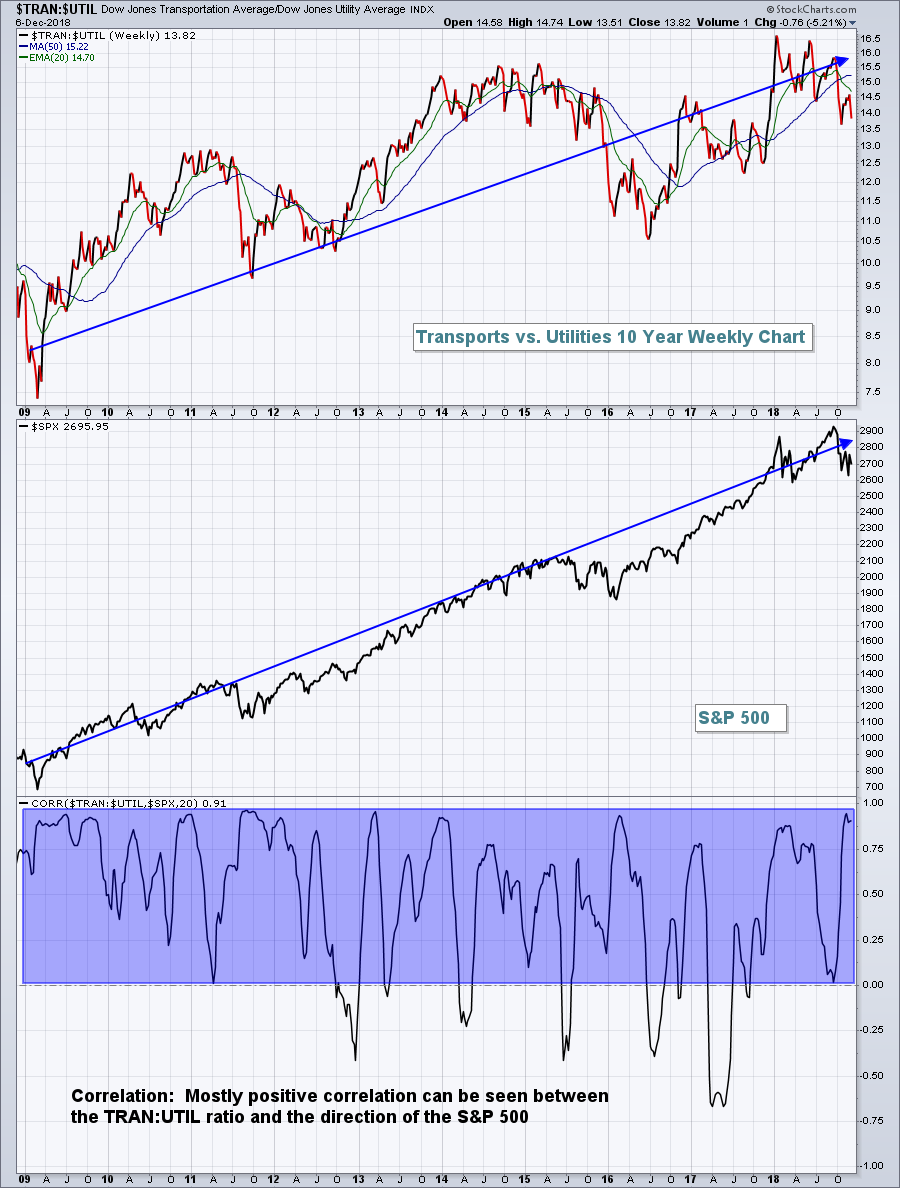 The blue shaded area highlights this positive correlation. While we've seen the TRAN:UTIL ratio turn lower without a recession or bear market in the past, it's still prudent to be aware of this ratio's recent decline in the event that the S&P 500 loses its February price support of 2582 as it confirms the possibility of economic turbulence ahead.
Sector/Industry Watch
The recent price level of XLE is similar to crude oil ($WTIC) if we compare current prices to their respective 2017 lows from the summer of 2017. However, their paths have been quite different at times. Crude oil's recent tumble has taken the XLE down to important 2018 support between 63-65. Yesterday's XLE low of 63.07 challenged the February 2018 low before bouncing into the close on Thursday. Should the XLE move below Thursday's intraday low, there's a strong likelihood the XLE will move down to test the longer-term low between 59-60:
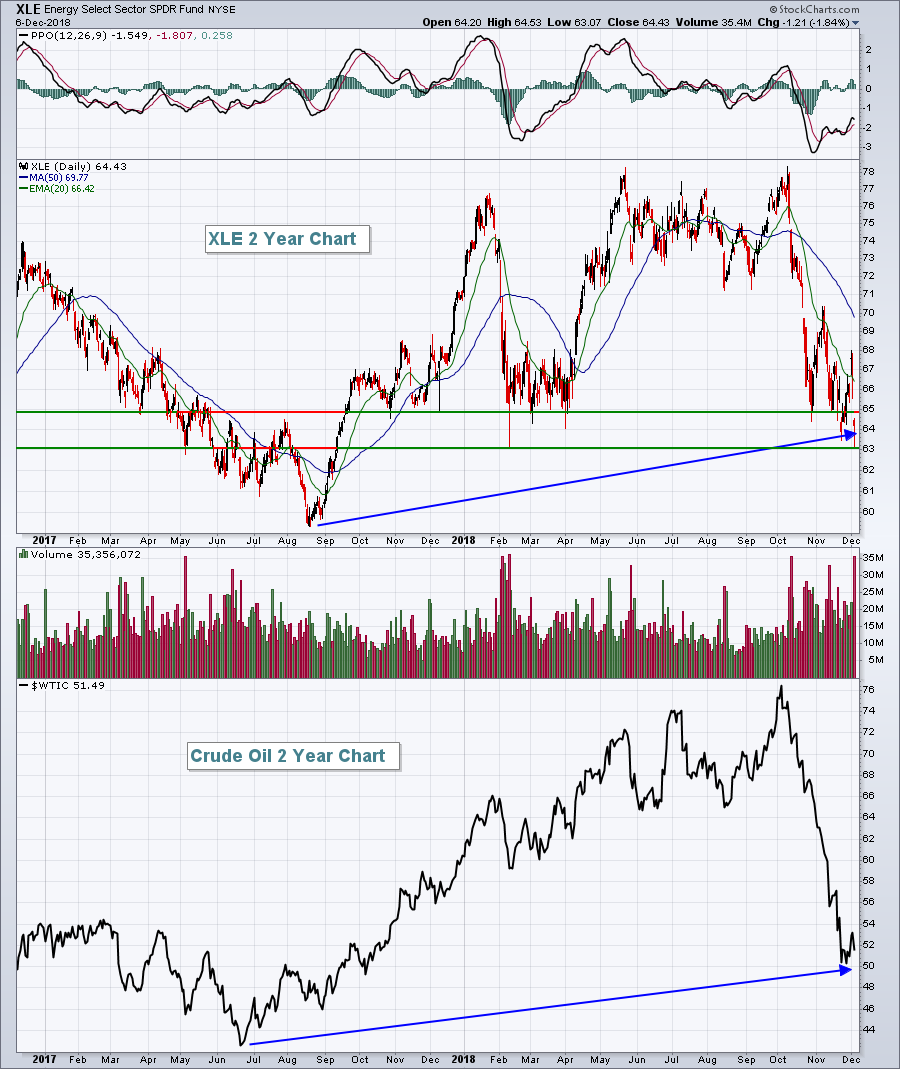 If support on the XLE near 63 is to hold, crude oil likely needs to find a bottom and begin trending higher.
Historical Tendencies
Over the past 20 years, Boston Scientific (BSX) has averaged losing money in every calendar month from June through November. The December through May period, however, has been very kind, producing average gains of 16.5% each year.
Key Earnings Reports
(actual vs. estimate):
MTN: (2.43) vs. (2.44)
Key Economic Reports
November nonfarm payrolls released at 8:30am EST: 155,000 (actual) vs. 190,000 (estimate)
November private payrolls released at 8:30am EST: 161,000 (actual) vs. 183,000 (estimate)
November unemployment rate released at 8:30am EST: 3.7% (actual) vs. 3.7% (estimate)
November average hourly earnings released at 8:30am EST: +0.2% (actual) vs. +0.3% (estimate)
December consumer sentiment to be released at 10:00am EST: 97.4 (estimate)
October wholesale trade to be released at 10:00am EST: +0.7% (estimate)
Happy trading!
Tom
