Market Recap for Friday, January 12, 2018
U.S. equities had another nice rally on Friday, this time led by a very strong consumer discretionary sector (XLY, +1.29%). Eight of the nine sectors finished higher, with utilities (XLU, -0.57%) the only area failing to participate. The XLU tends to struggle when treasury yields are rising, but the past three days have seen the XLU free fall while the 10 year treasury yield has essentially been flat. It's likely that technical selling is gripping the XLU and, if that's the case, technical buying should soon be here to rescue the sector:
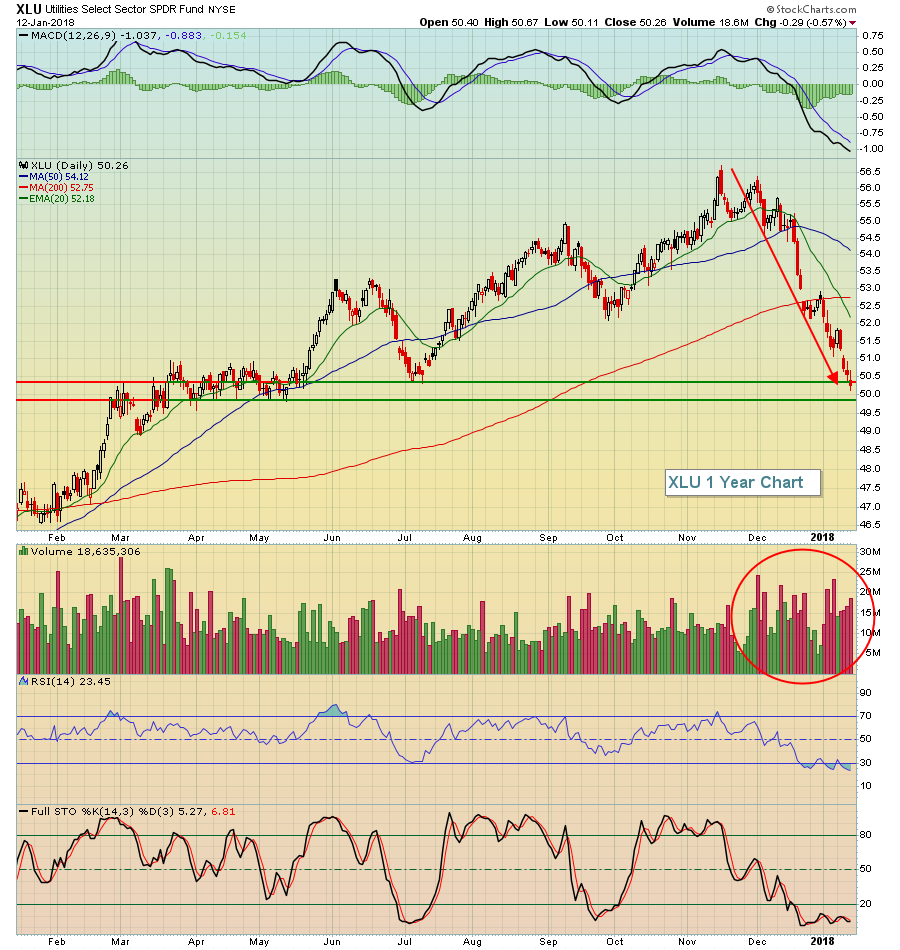 The volume has been very heavy, suggesting serious distribution as the market braces for potentially higher treasury yields in 2018. Note also that the recent drop has triggered very oversold conditions in the XLU with RSI readings mostly beneath 30 over the past few weeks.
But utilities is where the weakness in U.S. stocks ends. In addition to strength in consumer discretionary on Friday, energy (XLE, +0.97%), industrials (XLI, +0.93%) and financials (XLF, +0.90%) all gained close to 1% on the session. Money has consistently been rotating to aggressive areas of the market and there are currently no signs pointing to a change. Yes we're extremely overbought, but we're also in the grips of a raging bull market. Calling short-term and long-term tops in such a market is difficult. It's like catching a huge wave in a surfing contest. We just have to ride it out.
Pre-Market Action
Citigroup (C) reported excellent results this morning, beating expectations and the stock is currently trading nearly 3% higher in pre-market action. Dow Jones futures are very strong, up more than 200 points with an hour left to begin a new trading week.
Current Outlook
I've discussed on many occasions that negative divergences can be eliminated and selling into a negative divergence on a breakout can be premature. After a mature rally has printed, periods of profit taking generally result in a quick drop in the MACD. Once the uptrend resumes, we many times will see a lower MACD as prices break out to new highs. Acting on such signals and selling can be a big mistake. Therefore, I acknowledge the negative divergence, but I look for corroborating evidence that a top is forming or has formed. These additional signals can be (1) much lower volume to accompany the breakout, (2) a reversing candle or (3) loss of price support on the breakout, among perhaps a few others. Selling too early in a bull market can be just as risky as holding stocks when these topping signals begin to appear.
Take the financial sector, for instance:
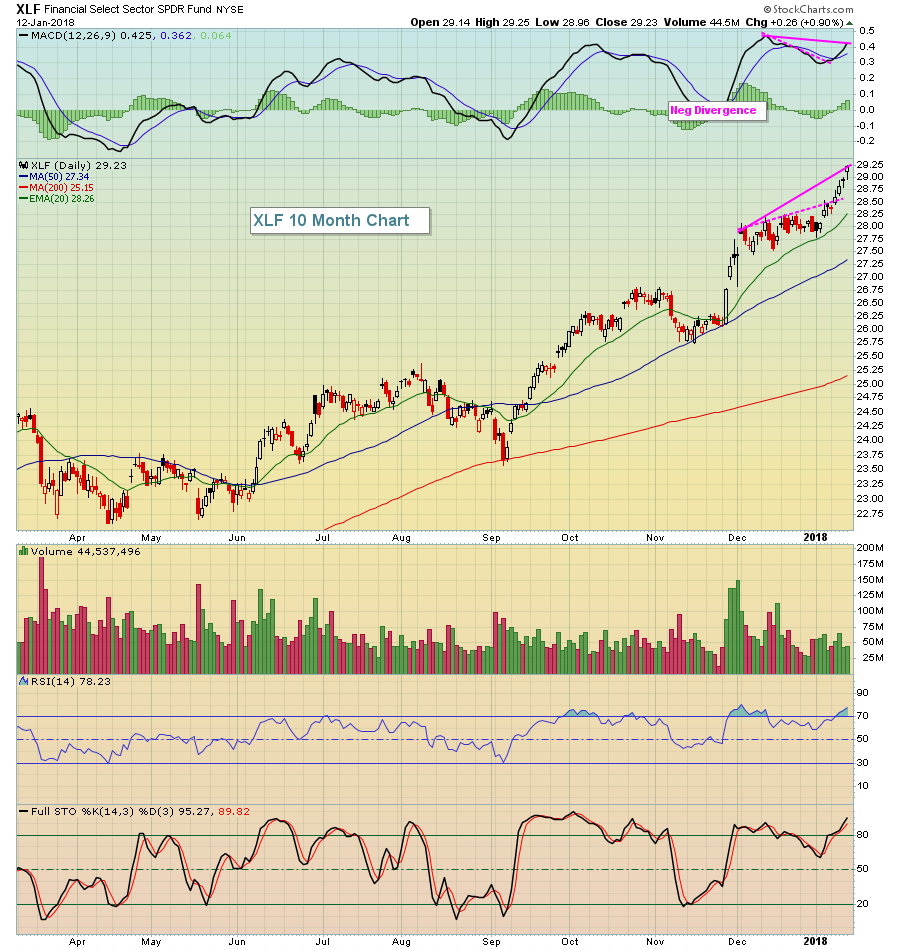 The pink dotted lines show the negative divergence that printed on the breakout earlier this month. But note that as prices continue to rise, that negative divergence is being eliminated. If the XLF continues to rise over the next couple days, there may be no negative divergence left on the chart. So the decision to sell at the first sign of slowing price momentum would have been a poor one.
Technical analysis can provide us very useful information and signals, but it never provides us a guarantee. Using corroborating signals is essential, much like putting together all the evidence at a crime scene.
Sector/Industry Watch
Media agencies ($DJUSAV) had been a very poor performing industry group within the consumer discretionary space and this weakness dates back approximately 18 months. But the selling did reverse once we tested key price support from 2014 and this is a group that could produce exceptional returns in 2018 and is worth watching. Here's the chart:
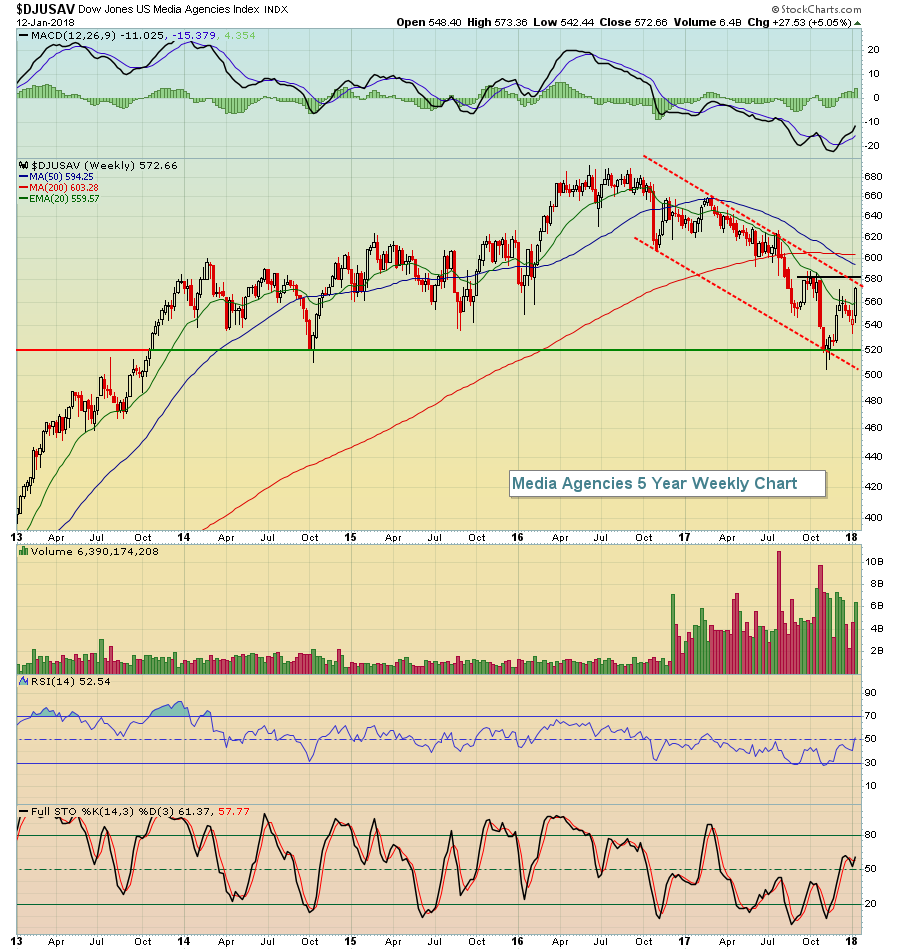 There have been two bullish developments thus far, in my opinion. First, we've climbed back above the declining 20 week EMA. An uptrend begins with price action clearing key moving averages. Confirmation comes if those moving averages are tested successfully from above and they begin to provide support. That test remains to be seen. The second bullish development is the fact that we've climbed above the late 2017 highs. There's still a price resistance test near 580, but at least short-term price resistance at 560 was negotiated.
This could very well be the early stages of a major advance and significant outperformance of the benchmark S&P 500. Future confirming price action will be key, along with upcoming earnings reports in this space.
Monday Setups
Each week I provide a handful of short-term trading candidates from my Strong Earnings ChartList. Companies that beat quarterly estimates as to both revenues and EPS are added to this ChartList so long as they're fairly liquid (average daily volume at least 200,000 shares) and have a healthy chart. All of my setups for the past month can be found HERE.
This week I'm focusing on Melco Resorts & Entertainment (MLCO) which, at Friday's low, had fallen approximately 10% from its high in late December. MLCO's RSI has fallen back to 45 and its price is testing both price and trendline support. Here's the chart:
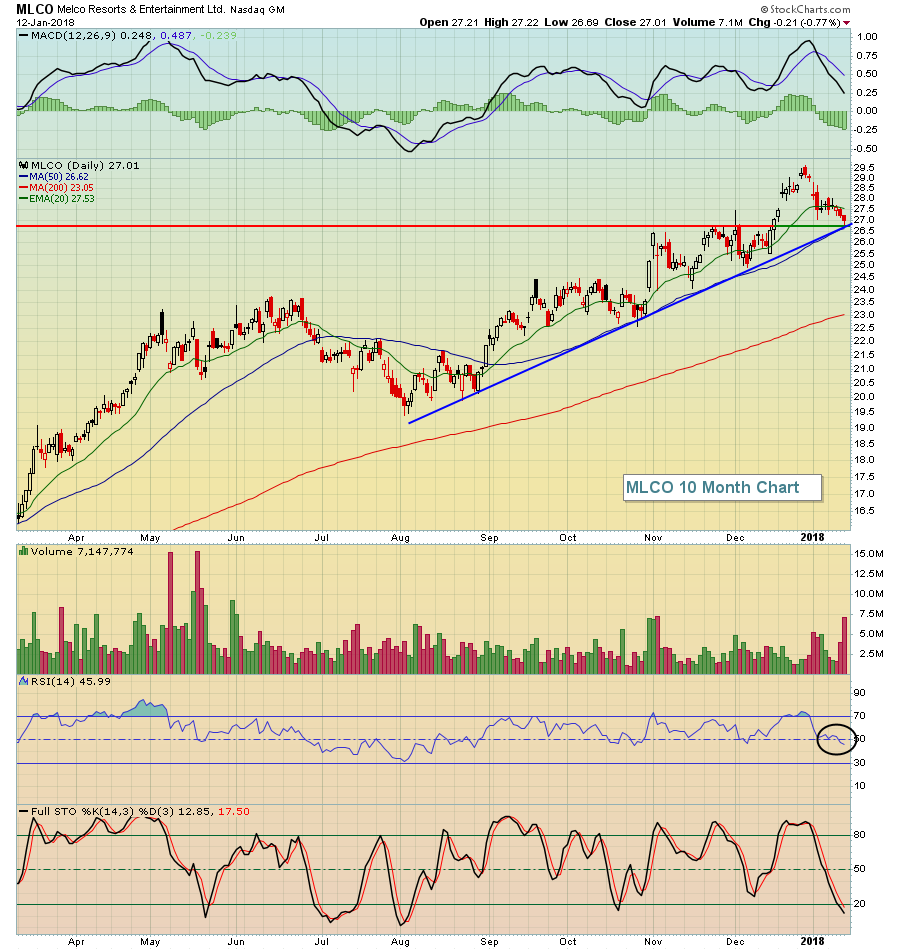 A close below 26.50 would be bearish. Otherwise, I'd look for MLCO to make another run to its December high just above 29.50.
Historical Tendencies
The bullish October 28th through January 18th period is winding down and officially ends on the S&P 500 on Thursday. It ends on the 19th (Friday) on the NASDAQ. Performance over the next three months tends to be positively correlated to the bullish period discussed above. In other words, strength is typically a precursor to more strength, good news for those in the bullish camp. More details on this in upcoming Trading Places blog articles.
Key Earnings Reports
(actual vs. estimate)
C: 1.28 vs 1.19
CMA: 1.24 vs 1.21
INFO: .52 vs .51
UNH: 2.59 vs 2.50
(reports aftr close, estimate provided):
CSX: .56
IBKR: .39
Key Economic Reports
January empire state manufacturing survey released at 8:30am EST: 17.7 (actual) vs. 18.6 (estimate)
Happy trading!
Tom
