Market Recap for Thursday, January 4, 2018
Where's the top? Who knows and the bulls don't seem to care. As of Wednesday, the Dow Jones was left out as the only index not to clear a psychological or significant price level for the first time ever in 2018. No worries, though, we can now cross that off the market's "To Do" list as the Dow Jones closed above 25,000 yesterday for the first time ever, rising another 152 points in the process.
Financials (XLF, +0.93%) and materials (XLB, +0.87%) led the charge on Thursday, with utilities (XLU, -0.83%) once again the laggard. I love seeing the rotation back into other aggressive areas like financials (industrials also performed well again), but we're seeing negative divergences emerge that could begin to slow the pace of this rally. For instance, banks ($DJUSBK) left a somewhat ominous candle yesterday and with slowing price momentum in place. Check it out:
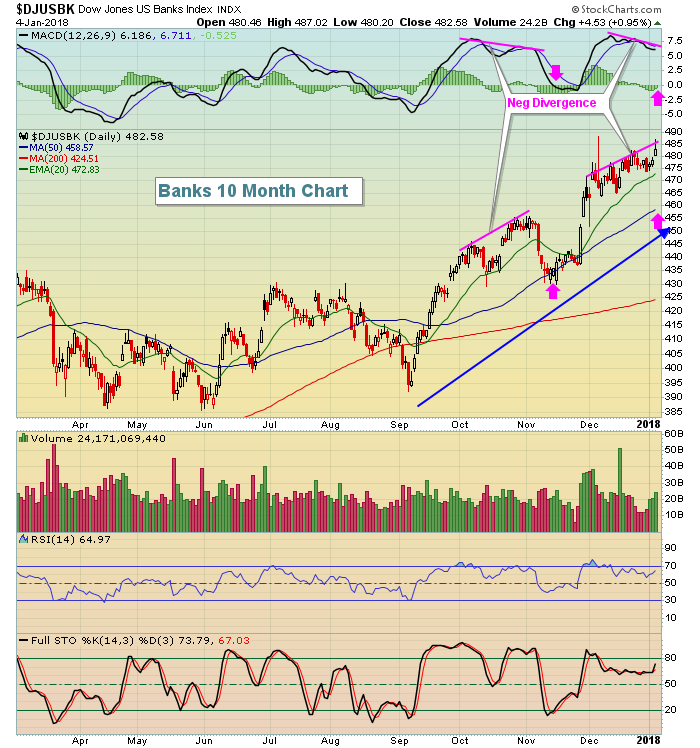 It's really a mixed picture here as we did still manage to make a closing breakout on the DJUSBK, but we ended the session well off the earlier high. Adding in the negative divergence just makes this look a bit suspicious.
Pre-Market Action
The December nonfarm payrolls report came in much weaker than expected as you can see below in the Economic Reports section. It was a fairly big miss, but the bulls could not care less. Dow Jones futures are higher by nearly 100 points as we approach the last trading day of the first week of 2018. It's been a great start to the year for equities as the global bull market continues.
Current Outlook
During a MarketWatchers LIVE show earlier this week, I pointed out a rather interesting fact and it probably goes against common sense. Before I get to that, if you recall, I previously discussed the stock market's tendency to rise from the October 27th close through the January 18th close. In fact, the S&P 500 has done so in 57 of the prior 66 years - dating back to 1950. So I decided to do a little further analysis to see if there was any correlation between the strength from October 27-January 18.....and the ensuing three month period ending April 18. What I found was quite startling. I first broke down that October 27-January 18 strength into four quadrants.
(1) Quadrant 1 - Best performing October 27-January 18 periods (best 17 years). 1963 was the best year as October 27, 1962 through January 18, 1963 resulted in an S&P 500 rise of 19.51%. Certainly, the S&P 500 deserved a rest after such a move higher. But it actually rose another 5.69% over the next three months! In fact, this "quartile" of best 10/27 to 1/18 periods averaged gaining 11.41% and the next three months averaged gaining an additional 5.79%!
(2) Quadrant 2 - Next best performing October 27-January 18 periods. Gains ranged from 4.82% (1954) to 8.40% (2006). The next three months averaged gaining 2.30%.
(3) Quadrant 3 - Third best performing October 27-January 18 periods. Gains ranged from 1.20% (1975) to 4.49% (2014). The next three months averaged gaining 3.03%.
(4) Quadrant 4 - The worst performing October 27-January 18 periods. The range here was from -14.20% (1974) to +0.93% (1990). The next three months averaged gaining a meager 0.89%.
So I came to one conclusion. Strength begets more strength. As of Thursday's close, the current October 27 to January 18 period is +5.54%. That would place 2018 in the second quadrant. The S&P 500 would need to rise another 82 points, or end the period above 2806 to reach that top quadrant.
But given the strength thus far, history suggests that we are very likely to see further strength throughout the first quarter of 2018.
Sector/Industry Watch
Adding to the theme of worrisome indications from the financial space, check out the chart of the Dow Jones U.S. Investment Services Index ($DJUSSB):
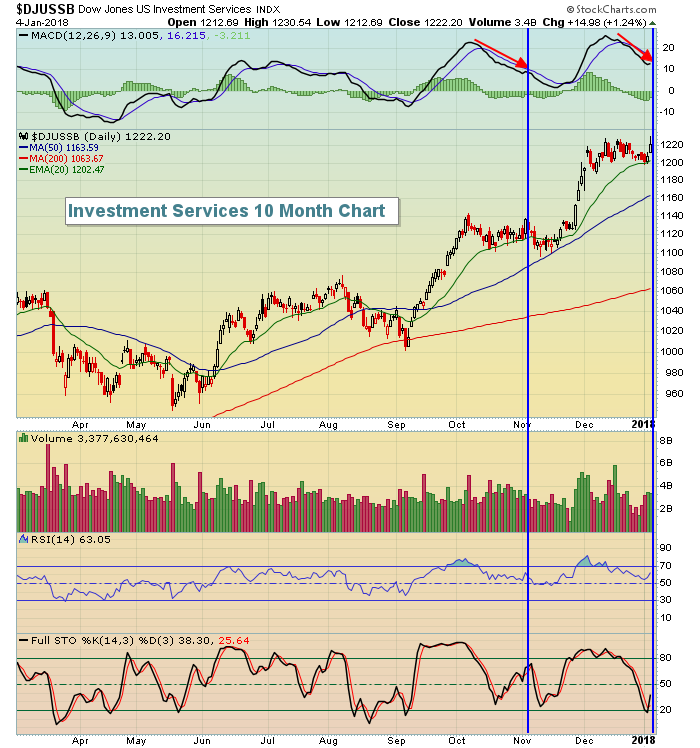 It seems that we've seen this attempt at a breakout with a weakening MACD before and it didn't work out so well. Volume trends have been strong here, so like the banks, there's a mixed picture for sure. But let's not forget that the market has become overbought and a little profit taking and consolidation would not be a bad thing at all.
Historical Tendencies
The S&P 500 doesn't have a great track record in January. The NASDAQ seems to control the table this month. But the start of January does tend to be kind to S&P 500 bulls. Since 1950, here's a breakdown of January performance on the S&P 500:
January 2nd to 6th: +38.39% (bullish)
January 7th to 13th: -20.24% (bearish)
January 14th to 18th: +30.07% (bullish)
January 19th to 24th: -10.13% (bearish)
January 25th to 31st: +31.37% (bullish)
Thus far, the early January strength is playing out according to history. So perhaps the question is whether the seasonal headwinds kick in next week and we finally see a bit of profit taking?
Key Earnings Reports
(actual vs. estimate):
STZ: 2.00 vs 1.87
Key Economic Reports
December nonfarm payrolls released at 8:30am EST: 148,000 (actual) vs. 191,000 (estimate)
December private payrolls released at 8:30am EST: 146,000 (actual) vs. 185,000 (estimate)
December unemployment rate released at 8:30am EST: 4.1% (actual) vs. 4.1% (estimate)
December average hourly earnings released at 8:30am EST: +0.3% (actual) vs. +0.3% (estimate)
November factory orders to be released at 10:00am EST: +1.1% (estimate)
December ISM non-manufacturing index to be released at 10:00am EST: 57.6 (estimate)
Happy trading!
Tom
