Market Recap for Thursday, December 21, 2017
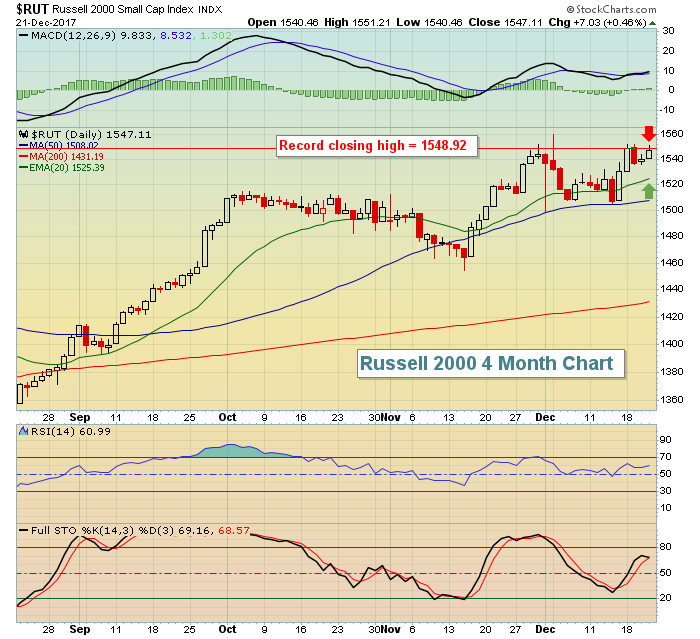
In afternoon trading, all of the major indices except the NASDAQ appeared headed for another record all-time high close. But a late afternoon selling bug hit Wall Street and much of those earlier gains disappeared. The small cap Russell 2000 was able to hold onto most of its gains, but still failed to close at a record high. The intraday high would have done it, but the chart below shows the tail left above closing resistance as the closing bell rang:
 Strength on Thursday came mostly from three sectors. Energy (XLE, +2.12%) continued its torrid pace as the group has risen 4.42% over the past week. I wrote a Don't Ignore This Chart blog article yesterday, highlighting the strength of Exxon Mobil (XOM), Chevron Corp (CVX) and Schlumberger (SLB), which are the three top holdings of the XLE, comprising close to 50% of its assets.
Financials (XLF, +0.86%) and consumer discretionary (XLY, +0.65%) also performed extremely well, with banks ($DJUSBK) benefiting from the recent spike in the 10 year treasury yield ($TNX). There's more on banks in the Sector/Industry Watch section below.
Pre-Market Action
The Dow Jones will attempt to keep its recent uptrend intact as we approach the Christmas holiday on Monday. All U.S. markets will be closed on Monday. With 30 minutes left before the opening bell, Dow Jones futures are flat.
Current Outlook
The consumer area of the market continues to perform well and the ratio that I always follow closely - consumer discretionary vs. consumer staples (XLY:XLP) - is on the rise and looking to challenge the early November high. A rising XLY:XLP indicates that investors/traders are favoring the more aggressive area of consumer companies - discretionary stocks. These are the companies that sell us the things that we want, not need. It delivers a message about the market psyche. It tells us that there's a favorable feeling among consumers. When the stock market struggles or enters a bear market, the XLY:XLP is understandably in a decline. Less disposable cash occurs with a struggling job market/economy and falling home prices can result in individuals feeling much less wealthy. So consumers begin to turn into "need-only" type buyers and tend to do without new homes, new cars or Starbucks coffee. Instead, spending tightens and a higher percentage of money is spent on the things we all need on a regular basis - toothpaste, soap, deodorant, detergent, etc. This translates into a declining XLY:XLP ratio as the prospects for consumer discretionary companies dwindle. Check out this long-term monthly chart:
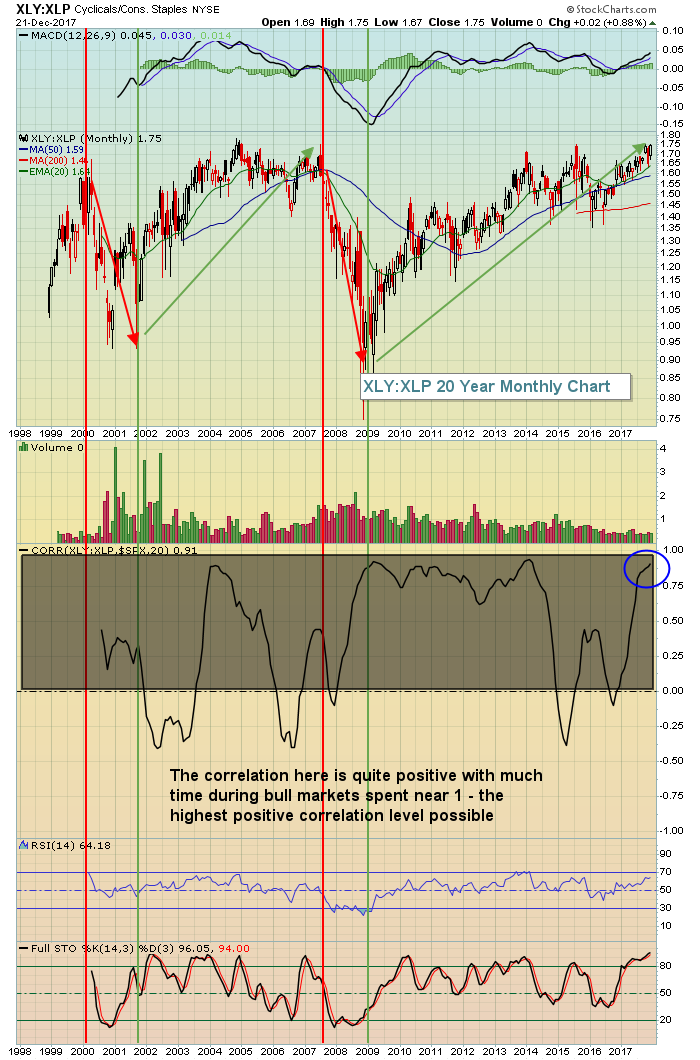
Currently, the correlation is near 1, telling us that the S&P 500 (higher) and the XLY:XLP ratio (higher) are trending together - a bullish recipe.
Sector/Industry Watch
The Dow Jones U.S. Banks Index ($DJUSBK) is rolling along with higher treasury yields. The latter causes net interest margins of banks to rise and drive higher EPS. It's also a sign of a strengthening economy and that helps to reduce loan loss reserves, a major contributor to the expense side. So while the fundamental picture is aligning beautifully for this industry, it's reflected in the price action:
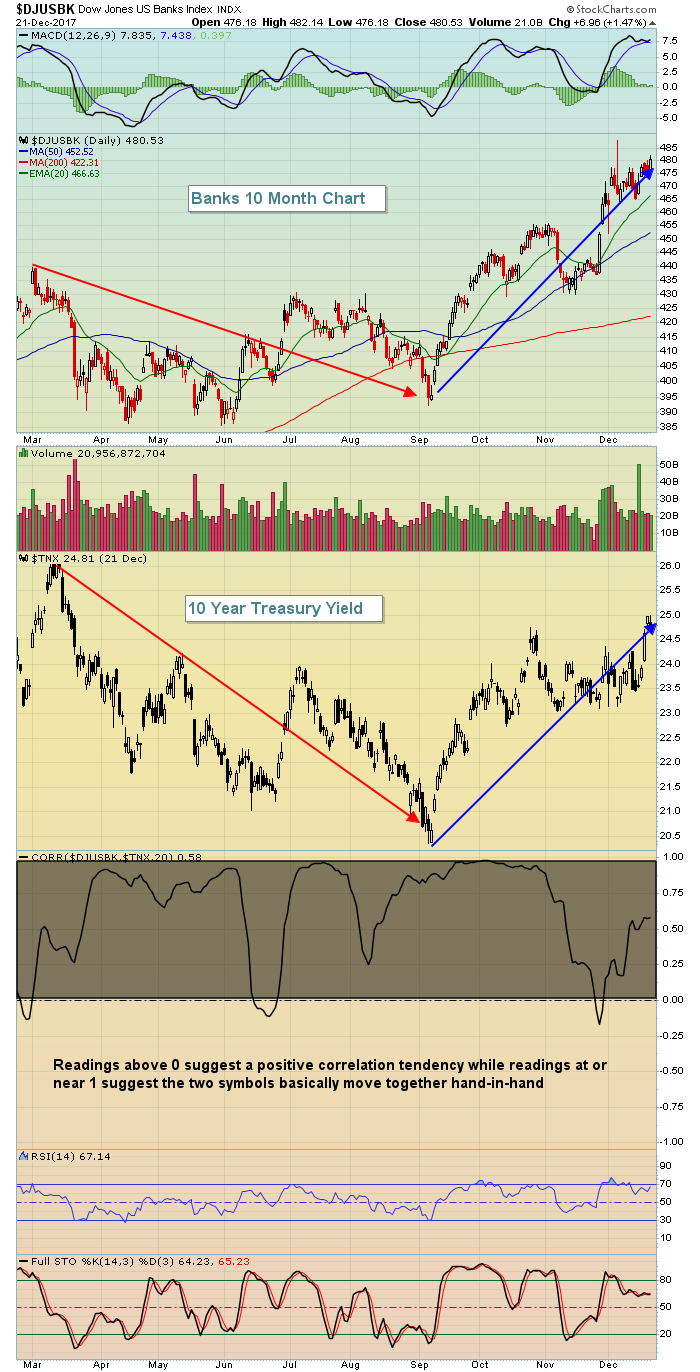 An astute technician might note that recent price action to new highs is accompanied with a lower MACD reading - a negative divergence suggesting slowing price momentum. But it's a very slight negative divergence and the MACD is turning higher again. If banks continue to rise, it's probably just a matter of time before the MACD moves to a new high as well. I'm always careful not to act on a negative divergence prematurely. As long as that rising 20 day EMA provides solid support, I'd be okay holding bank stocks for further short-term gains.
Historical Tendencies
I haven't update this stat in several years, but from 1971 through 2011, Fridays produced annualized returns on the NASDAQ of +26.39%, trailing only Wednesday's 28% gains. Mondays were by far the worst day during that four decade stretch, producing annualized returns of -32%. Not every day is created equal on Wall Street.
Key Earnings Reports
None
Key Economic Reports
November durable goods released at 8:30am EST: +1.3% (actual) vs. +2.0% (estimate)
November durable goods ex-transports released at 8:30am EST: -0.1% (actual) vs. +0.5% (estimate)
November personal income released at 8:30am EST: +0.3% (actual) vs. +0.4% (estimate)
November personal spending released at 8:30am EST: +0.6% (actual) vs. +0.5% (estimate)
November new home sales to be released at 10:00am EST: 650,000 (estimate)
December consumer sentiment to be released at 10:00am EST: 97.0 (estimate)
Happy trading!
Tom
