Reminder
If you enjoy my blog, be sure to subscribe at the bottom of this article! Just type in your email address and click on the green "Notify Me!" button. My articles will then be sent to your email immediately upon publishing! It's 100% free and you won't be spammed. Thanks and best of luck with your trading!
Market Recap for Monday, November 13, 2017
Monday marked more rotation from the overbought and momentum-challenged aggressive sectors to the more defensive-oriented groups. The current short-term rotation as the benchmark S&P 500 consolidates to work off its own overbought issues should not be interpreted as a bearish development. However, continuing relative strength in defensive sectors to accompany the next S&P 500 breakout would begin to paint a much more cautious picture so we'll need to keep that on our radar.
For now, simply consider the rotation a healthy development to sustain a longer-term bull market and there's nothing wrong with that. Utilities (XLU, +1.19%) and consumer staples (XLP, +0.57%) stood at their recent familiar spots atop the sector leaderboard, while energy (XLE, -0.57%) and industrials (XLI, -0.34%) occupied the bottom two spots. From the charts below, both the XLE and XLI are fine technically and traders should welcome the recent selling for different reasons:
XLE (overbought near-term):
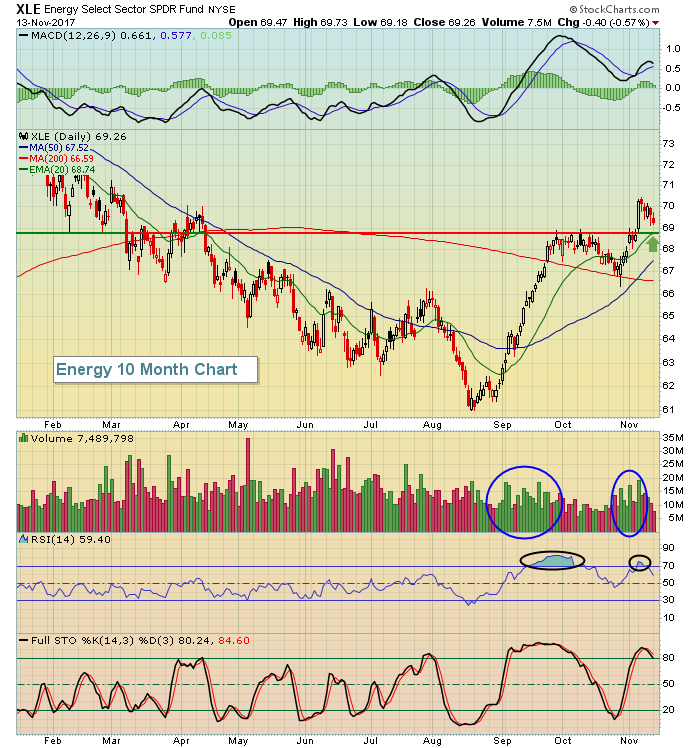 The blue circles highlight the improving volume trends. I'm not a big fan of evaluating volume on ETFs, but it does at least indicate that interest in energy is picking up. Also, while Coors Light might suggest that the you want your mountains turning blue, it's not a great technical development for a trader. The "blue mountains" above outlined in black tell us that energy was short-term overbought (RSI readings above 70) and that a pullback would represent relief from these overbought conditions. Both the rising 20 day EMA and price support intersect just below 69 so additional selling down to that level should be considered normal profit taking. A close beneath that level would require us to re-evaluate the technical outlook.
XLI (slowing momentum resolved):
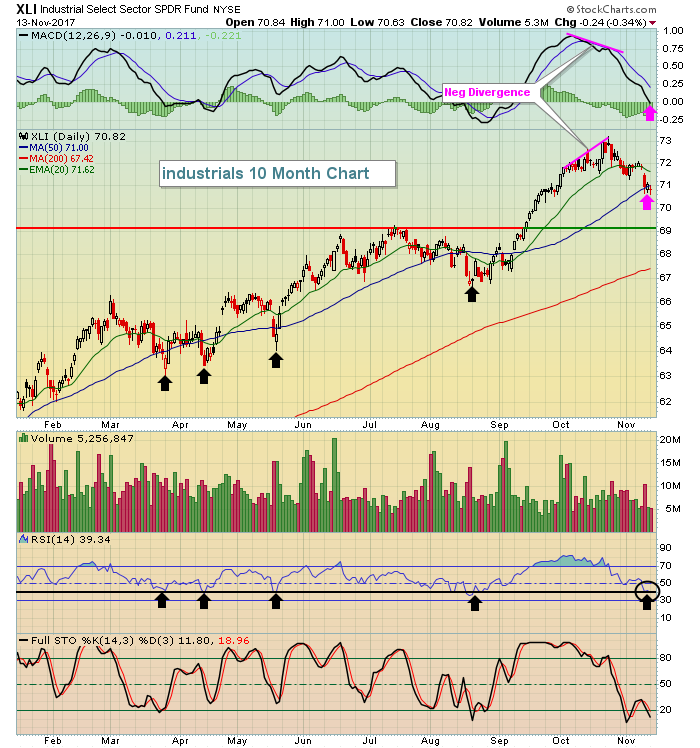 Listen, hindsight is 20/20 for sure. Taking a look at what just happened and then explaining why is rather easy because you know you'll be 100% correct every time. But we do receive "warnings" regularly in the stock market and then we have to decide how to react. These warning signs may not matter to long-term buy-and-hold investors as movements back and forth on the daily chart are just a blip on the weekly and monthly charts. But for those of us that trade in the near-term, it's very important to recognize risks as they develop. The XLI was a perfect example. Check out the technical signals in the XLI at its recent high. It was extremely overbought with an RSI at 80. Price momentum had slowed and the printing of a negative divergence was quite evident. These signs do not provide us guarantees. But they sure as heck let us know that risks of entering or holding short-term positions in this space are growing. The last three weeks have been painful for many industrial stocks, but they've simply been a victim of the process of bull market rotation. To be a really successful trader, you have to be able to avoid trading in higher risk areas.
Pre-Market Action
October PPI and Core PPI were both reported much higher than expected (details below in Economic Reports section). That has sent the 10 year treasury yield ($TNX) to its highest level of the morning, slightly above 2.40%.
Dow Jones futures are down 47 points as we approach the opening bell. Bulls will try to reverse the early weakness, just as they did on Monday.
Current Outlook
Transportation stocks ($TRAN) have not been participating in the latest advance within this 8+ year bull market. But the big question is will they? Well, we're about to find out as their long-term uptrend line is being tested:
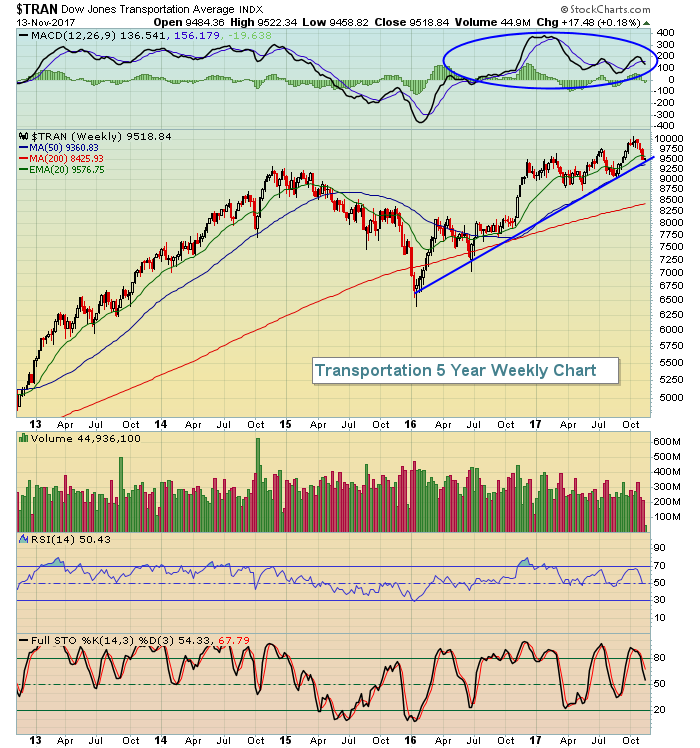 Note that the weekly MACD has been above the centerline for nearly all of 2016 and 2017. That tells me that momentum remains positive. Also, we're now testing what's been very solid trendline support. So while the recent action hasn't been great, I believe transports are close to a significant longer-term bottom. Railroads ($DJUSRR) currently look the most bullish area within transports to me.
Sector/Industry Watch
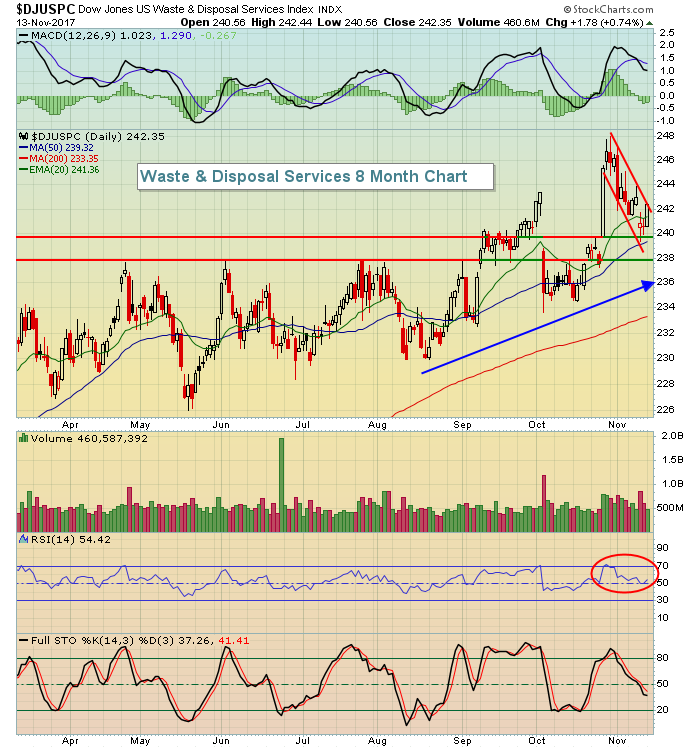
The Dow Jones U.S. Waste & Disposal Services Index ($DJUSPC) is a perfect example of an industry group following its industry lower, helping to unwind overbought conditions. It now appears "coiled" to me and ready for another surge to the upside. Check out the chart:
Historical Tendencies
November through January have clearly been the three best calendar months of the year on the NASDAQ since 1971. Here are their annualized returns:
January: +28.21%
December: +22.70%
November: +19.67%
All of the January strength occurred from 1971 to 1999 as the 2000s have not been kind to January. Since 1999, the best and worst calendar months on the NASDAQ have been as follows:
October (best): +31.49%
September (worst): -19.84%
Key Earnings Reports
(actual vs. estimate):
AAP: 1.43 vs 1.22
HD: 1.84 vs 1.81
TJX: 1.00 vs 1.00
Key Economic Reports
October PPI released at 8:30am EST: +0.4% (actual) vs. +0.1% (estimate)
October Core PPI released at 8:30am EST: +0.4% (actual) vs. +0.2% (estimate)
Happy trading!
Tom
