Market Recap for Wednesday, October 18, 2017
The Dow Jones sliced through 23000 like a hot knife through butter. Many times, these round numbers represent a psychological challenge for traders, but that was not an issue for this bull market. Instead, the Dow Jones soared 160 points to yet another all-time closing high. The S&P 500 and NASDAQ followed suit, posting fresh new highs of their own. Leadership returned to financials (XLF, +0.53%) and technology (XLK, +0.25%) as the 10 year treasury yield ($TNX) turned higher and broke its recent downtrend. Stock traders are excited about the prospects of another breakout in the TNX as that would signal additional selling in the bond market, aiding higher equity prices. We need to see the TNX clear the 2.40%-2.42% area.
Financials bounced exactly where you'd expect and now the group is trapped between 20 day EMA support and price resistance at 26.50, its most recent price high:
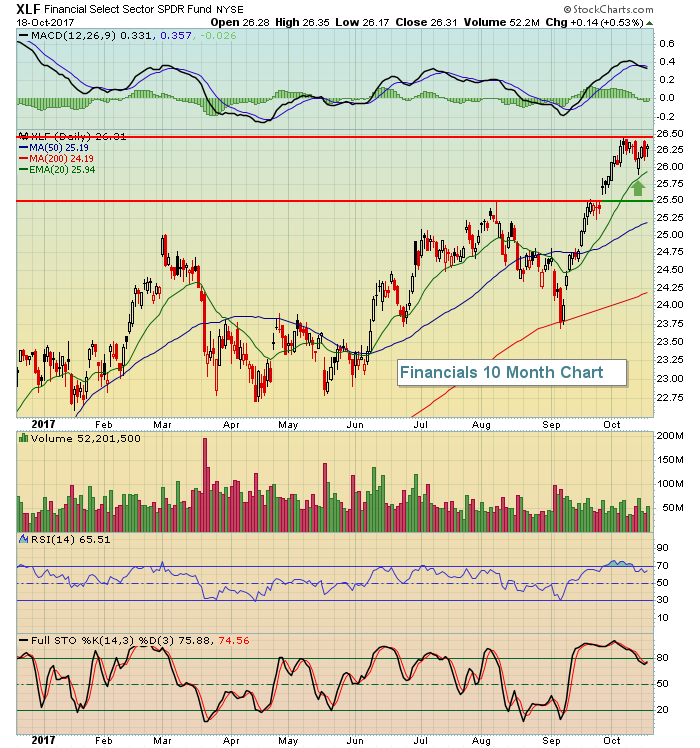 Price support and price resistance are at 25.50 and 26.50, respectively, but the rising 20 day EMA, currently at 25.94 - close to the recent price low - should provide near-term support on profit taking.
Energy (XLE, -0.70%) was the day's primary laggard as the sector nearly tested its rising 20 day EMA for the first time since breaking above that key moving average in early September.
Pre-Market Action
There aren't many places to turn this morning as profit taking appears to be the theme for today. The Hang Seng Index ($HSI) tumbled more than 500 points, or nearly 2%, overnight in Asia. That weakness has carried over to morning trade in Europe with the German DAX ($DAX) lower by more than 100 points, or 0.85%. And here in the U.S.? Dow futures are down 100 points with roughly a half hour left before the opening bell.
In the near-term, money is rotating to treasuries and gold ($GOLD) as the 10 year treasury yield ($TNX) is down a few basis points, while GOLD has tacked on 5 bucks to $1288.
The good news, of course, is that U.S. equities need a reprieve to catch their collective breath and we're heading into the best week of the year in terms of profit taking or outright selling.
Current Outlook
Futures are pointing to a lower open and, to be quite honest, we're in need of some selling as we continue to move further and further into overbought territory. Take a look at this six month chart on the NASDAQ:
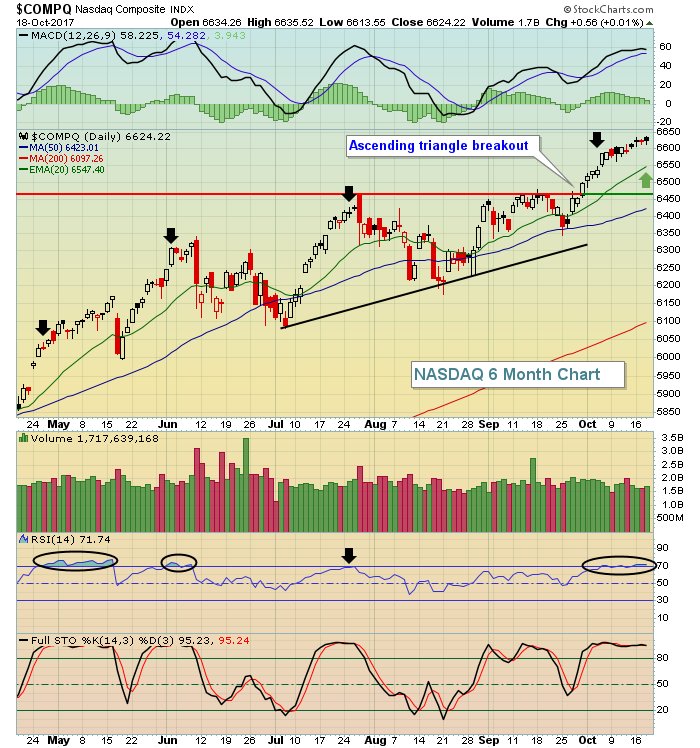 Over the past six months, check out the three previous times we've moved into overbought (RSI > 70) territory on the NASDAQ. We've generally topped short-term, although this overbought period is looking a lot like the early May time frame. After a quick selloff then to unwind overbought conditions, the rally resumed. It would seem as though we could be in for a similar setup now. Look for initial support at the rising 20 day EMA, currently at 6547, while intermediate-term price support can be found at that triangle breakout close to 6460.
Sector/Industry Watch
The Dow Jones U.S. Steel Index ($DJUSST) continues to take advantage of the seasonal tailwinds I discussed earlier this month. Yesterday, the group traded up 0.80% to approach key price resistance:
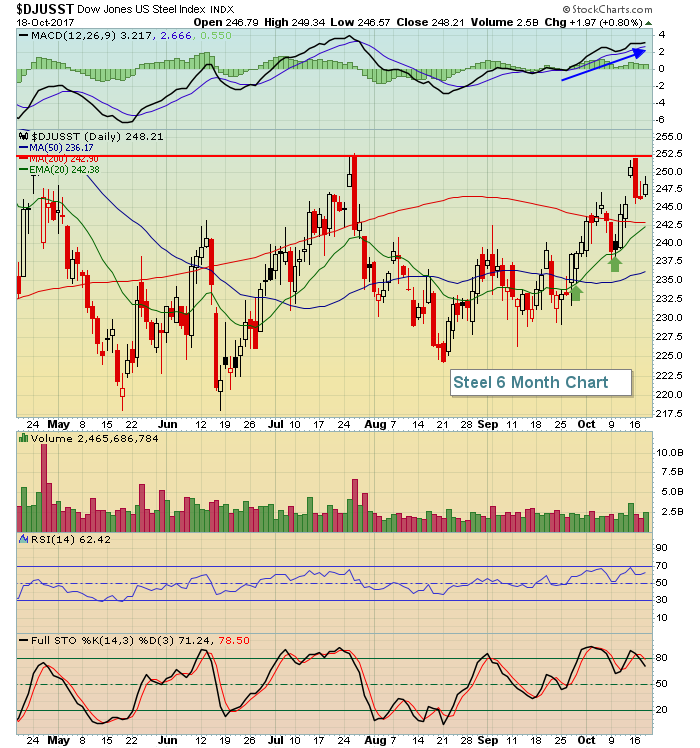 A break above 252.50 would be significant, representing a six month high. The index has been acting very bullishly with successful tests at the rising 20 day EMA (green arrows). A breakout would confirm this bullish trend.
Historical Tendencies
Next week is a bearish week. Here are the annualized returns for each day next week for the NASDAQ (since 1971):
Monday (October 23): -47.98%
Tuesday (October 24): -60.33%
Wednesday (October 25): -73.17%
Thursday (October 26): -73.31%
Friday (October 27): -91.93%
Key Earnings Reports
(actual vs. estimate):
BBT: .78 vs .78
BK: .94 vs .93
BX: .69 vs .55
DHR: 1.00 vs .95
PM: 1.27 vs 1.39
PPG: 1.52 vs 1.52
SAP: 1.01 vs 1.01
TRV: .91 vs .52
TSM: .57 vs .56
VZ: .98 vs .98
(reports after close, estimate provided):
ISRG: 1.97
PYPL: .44
Key Economic Reports
Initial jobless claims released at 8:30am EST: 222,000 (actual) vs. 240,000 (estimate)
Philadelphia Fed business outlook survey released at 8:30am EST: 27.9 (actual) vs. 20.2 (estimate)
September leading indicators to be released at 10:00am EST: +0.1% (estimate)
Happy trading!
Tom
