Market Recap for Monday, October 9, 2017
The U.S. major stock market indices took a breather - if you want to call it that - on Monday as the Dow Jones, S&P 500 and NASDAQ all fell less than 0.25%. Only the Russell 2000 lost more than that, dropping 0.44%, but small caps benefited from a huge rally that began in mid-August so let's cut them a little slack. While it may not have looked like much, the slight selling actually helped on the hourly charts as you can see below:
NASDAQ:
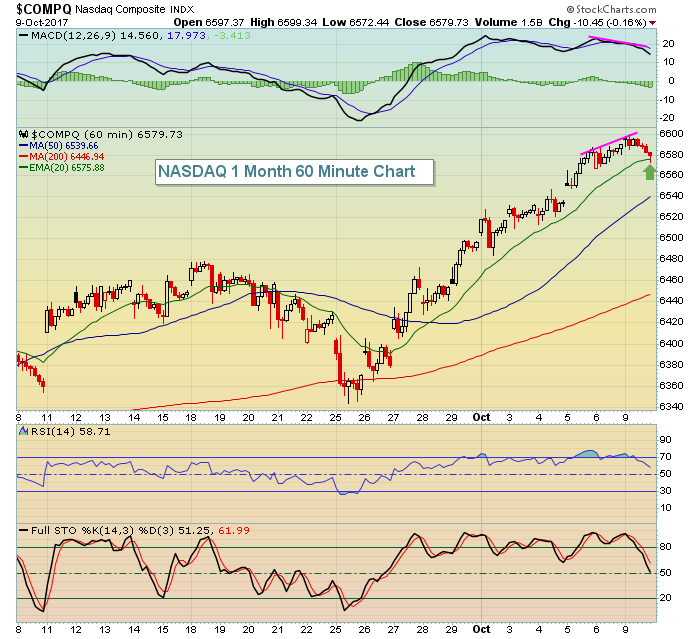 The selling did at least send the NASDAQ down to test its rising 20 hour EMA for the first time in two weeks. However, there's a negative divergence in play so another move beneath the 20 hour EMA could result in a 50 hour SMA test, currently at 6539.
Russell 2000:
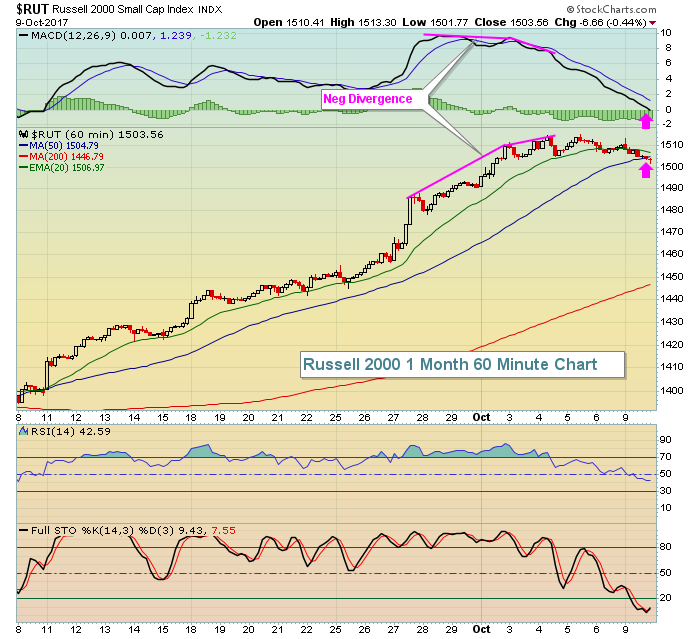 When negative divergences emerge, I always look to the MACD centerline "reset" and 50 day SMA test as potential targets. Now that we've hit those, let's look for a possible reversal. While the 60 minute divergence has been resolved, there are still issues on the daily chart like overbought conditions. The daily RSI on the Russell 2000 remains near 75 and a normal rising 20 day EMA test there would require another 30 point drop, or 2%, on the RUT.
Despite rather boring action on Monday, technology (XLK, +0.25%) did manage to lead the action while healthcare (XLV, -0.63%) took the brunt of the selling. Consumer discretionary (XLY, -0.32%) was a relative laggard, but mostly because of technical selling at a major resistance level. The XLY is featured in the Current Outlook section below.
Pre-Market Action
The 10 year treasury yield ($TNX) is relatively flat this morning after the bond market was closed on Monday in observance of Columbus Day. Banks were also closed and that helps to explain yesterday's anemic volume levels. Gold ($GOLD) is rallying a bit as it once again approaches the $1300 level. Gold traders are a bit nervous as higher rates could strengthen the dollar, putting further pressure on gold prices.
With 30 minutes left to the opening bell, and with no earnings or economic reports on tap for today, Dow Jones futures are up 51 points.
Current Outlook
Consumer discretionary (XLY) is a very important part of our market because consumer spending is estimated to be roughly 67% of GDP. I am constantly monitoring the relationship between the consumer stocks - discretionary vs. staples (XLP). While many times I illustrate this relationship by using the XLY:XLP ratio, I think a better illustration right now is comparing where the two sectors are technically on their respective daily charts. Check this out:
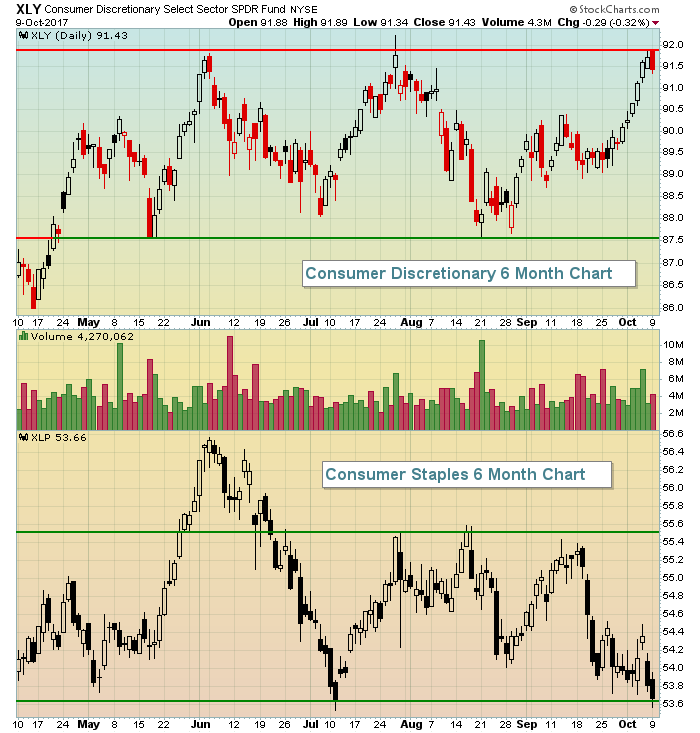 The more aggressive area of consumer stocks - discretionary - is threatening a major breakout, while the safer sector - staples - battles to hang onto significant price support. Strength clearly lies in consumer discretionary and that should help to drive overall equity prices higher into year end, especially if the XLY makes this breakout, which I believe it will in time.
Sector/Industry Watch
Retail has been horrible in 2017, but the specialty retailers ($DJUSRS) have been an exception. Yesterday's drop of 1.07% was noteworthy because after opening strength, sellers emerged and by day's end, the DJUSRS printed a bearish engulfing candle - likely a near-term top:
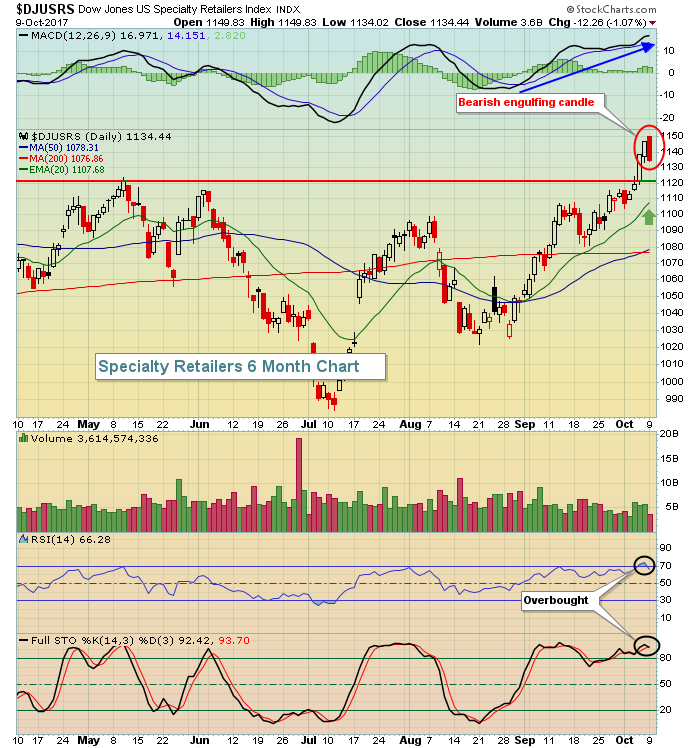 The index is overbought and could use some short-term relief. Price support just above 1120 and the rising 20 day EMA, currently at 1107, are the two likely reversal levels on further weakness. This selling would set up beautifully for entry after the longer-term bullish breakout that we saw on the weekly chart:
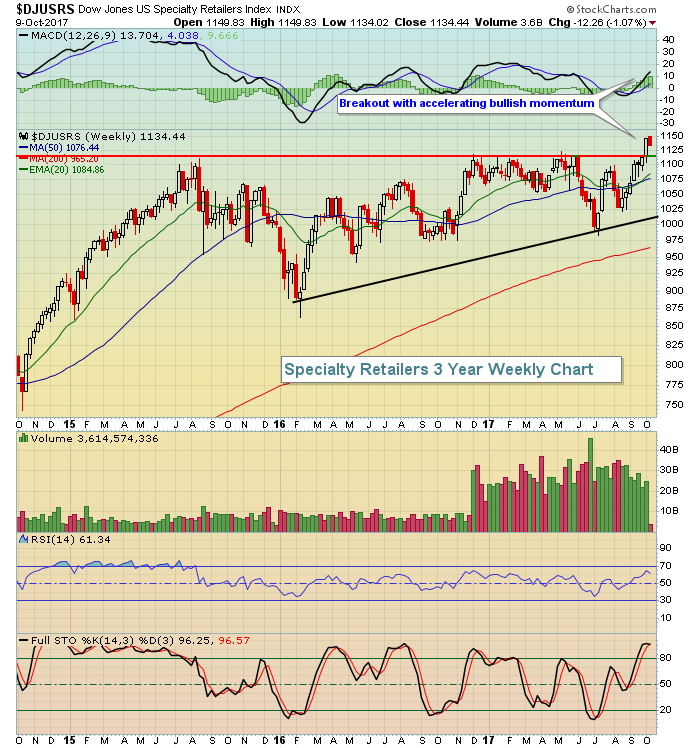 The DJUSRS consolidated in a very bullish ascending triangle pattern for more than two years. Expect long-term relative strength in this area of the market now that price resistance has been cleared.
Historical Tendencies
Yesterday, I highlighted that this is a very bullish week historically on the NASDAQ since 1971. Today, I'll provide you the details of the S&P 500 since 1950:
October 9 (Monday): -83.85%
October 10 (Tuesday): +27.38%
October 11 (Wednesday): +38.23%
October 12 (Thursday): +1.91%
October 13 (Friday): +63.99%
The rise in S&P 500 prices the past few weeks is more typical than not. In fact, the few weeks leading up to earnings season in each of the four quarters tends to be quite bullish. Once the earnings reports begin to hit the Street, however, profit taking normally kicks in. The worst week of the year - historically - is rapidly approaching. Stay tuned, I'll be providing more historical details right here over the next couple weeks.
Key Earnings Reports
None
Key Economic Reports
None
Happy trading!
Tom
