Market Recap for Thursday, October 5, 2017
Well, if you were worried about an underperforming technology sector and the inability of the NASDAQ 100 ($NDX) to reach new highs, you can stop worrying. Both broke out on Thursday with emphatic moves to clear highs established over the summer. First, check out the bullish ascending triangle pattern that was cleared on the NDX:
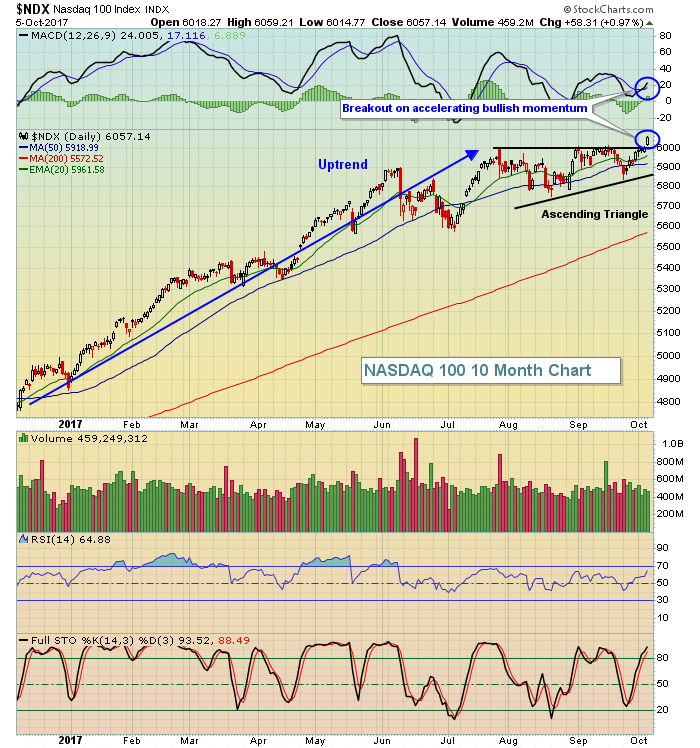 Momentum is just beginning to accelerate from its launch near centerline support. The top of the triangle is at 6000 and the initial low in the pattern was approximately 5750. That difference, 250 points, is the measurment, which is added to the breakout level at 6000 to establish an initial target of 6250. Expect to see that rather quickly. To the downside, the two key support levels will now be the breakout level and rising 20 day EMA at 6000 and 5962, respectively. Look to those levels to hold and for buyers to re-emerge during any short-term period of selling.
What's likely to benefit from renewed strength in the NDX? Technology (XLK, +0.96%). Internet stocks ($DJUSNS) led technology yesterday and had a breakout of its own:
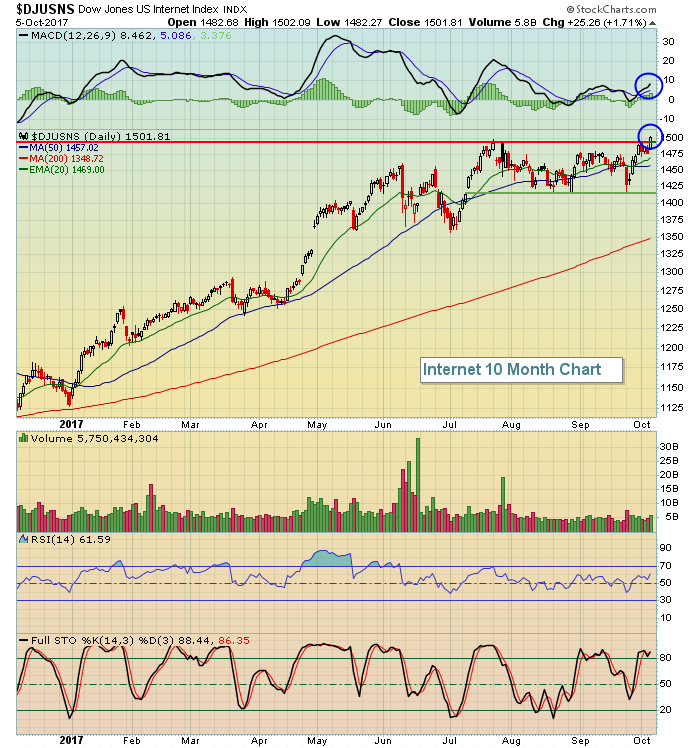 Recently, we saw the DJUSNS pause with key gap and price support near 1415 holding. That weakness helped to alleviate previously overbought conditions back at the July high with an RSI trip to test 40 support on the most recent low less than two weeks ago. Now the group is breaking out with an RSI of 61. There's room to run.
Financials (XLF, +1.04%) actually led Thursday's rally with key areas leading like investment services ($DJUSSB) and banks ($DJUSBK). After a rare day of profit taking, the DJUSBK rallied 1.28% to help the XLF post its highest close ever at 26.32.
As further bullish confirmation, the wide participation in the rally continued with every sector rising except utilities (XLU, -0.09%). The uptrend in the 10 year treasury yield ($TNX) is keeping a lid on utilities.
Pre-Market Action
After the September jobs report came in well below expectations, futures moved lower. It'll be interesting to see how the market performs today with bad news and a low Volatility Index ($VIX). Typically, the stock market ignores bad news or makes excuses for bad news when it's expecting little volatility. It's a hallmark of a bull market. The other side of the coin, however, is that we're very overbought and could use a short-term correction. Keep in mind that we're ending what is typically a very bullish 26th to 6th period of the calendar month as today is October 6th.
A surprise, however, is that the 10 year treasury yield ($TNX) is up a few basis points despite the weak jobs report. That should keep a bid under financial stocks, although other areas could see some profit taking.
Dow Jones futures are lower by 33 points with 30 minutes left to the opening bell.
Current Outlook
I am always looking "under the surface" of the market to evaluate bull market advances. The most important aspect of a sustainable advance is that money should be rotating towards aggressive areas of the market. Below is a three month chart of the S&P 500, supported by four key ratios that are accelerating higher as well. This suggests to me that this rally has legs. Take a look:
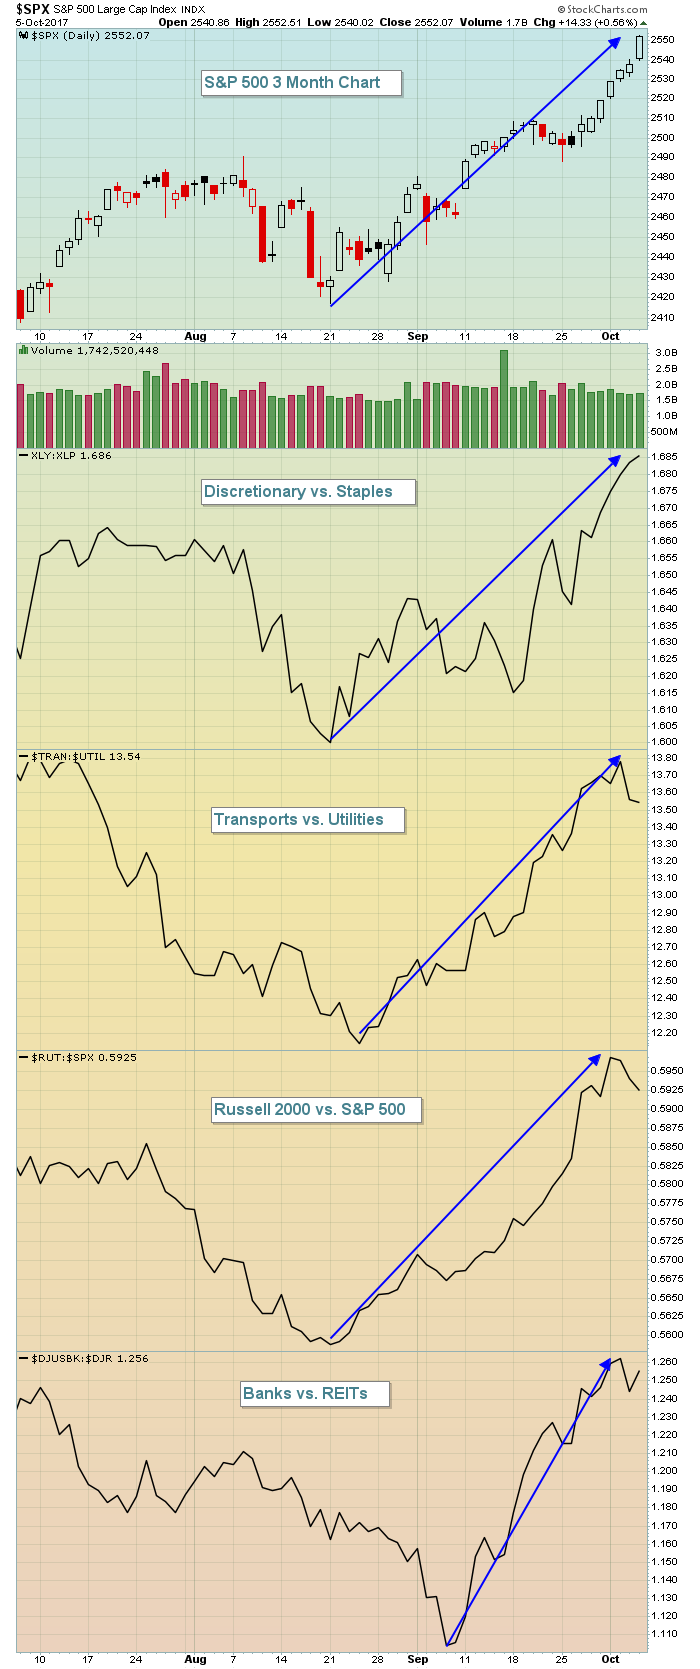 This looks like very bullish action to me. I believe we'll see further strength ahead.
Sector/Industry Watch
Looking for a group that might be ready for a rebound? Consider footwear ($DJUSFT). It's the worst performing industry within the consumer discretionary space over the past week and it's close to price support. Check it out:
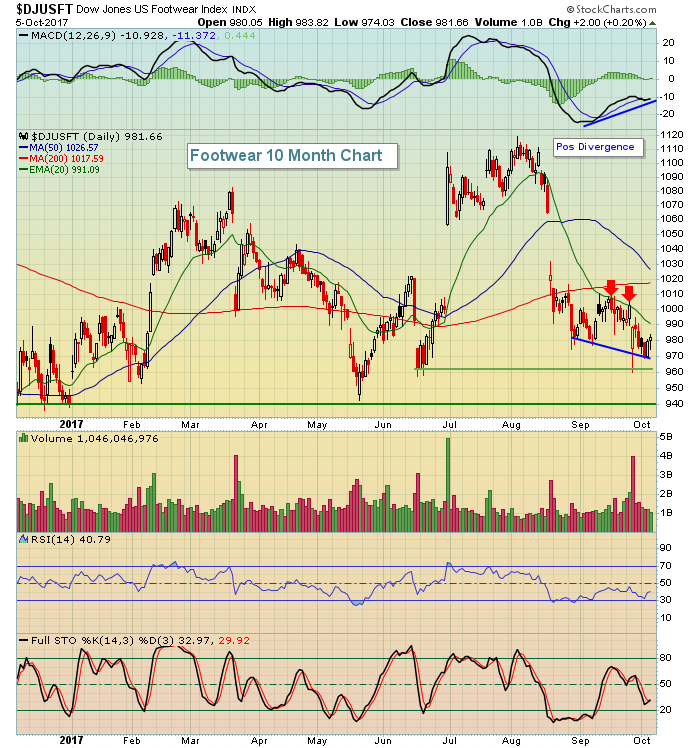 Note that the most recent trips to test the declining 20 day EMA failed, but with a positive divergence now in play, I believe the DJUSFT could be poised for a much more significant rally. Another interesting fact: Over the past 18 years, the September through November period is the best three consecutive month stretch for footwear, averaging 8.4% gains in just those three months. History is telling us that the DJUSFT is primed for a rebound. Nike (NKE) would be an interesting trade candidate because it too tends to perform its best in the latter part of calendar years and could also benefit from a very strong positive divergence on its daily chart.
Historical Tendencies
Historically, the 6th day of the calendar month is bullish as the NASDAQ has produced annualized returns of +6.85% since 1971. But it's a clear drop from the 5th's annualized return of +37.69% and it's a precursor to typical weakness (profit taking) from the 7th through the 10th:
7th: -11.90%
8th: +8.73%
9th: -19.86%
10th: +12.94%
The 9th is the third worst day of the calendar month, trailing only the 20th (-33.97%) and 19th (-29.17%). October 9th also falls on a Monday this year, easily the worst day of the calendar week. Given the overbought conditions on our major indices and the historical weakness described above, I wouldn't be surprised to see some near-term profit taking early next week, especially if we finish weak today.
Key Earnings Reports
None
Key Economic Reports
September nonfarm payrolls released at 8:30am EST: -33,000 (actual) vs. 100,000 (estimate)
September private payrolls released at 8:30am EST: -40,000 (actual) vs. 117,000 (estimate)
September unemployment rate released at 8:30am EST: 4.2% (actual) vs. 4.4% (estimate)
September average hourly earnings released at 8:30am EST: +0.5% (actual) vs. +0.3% (estimate)
August wholesale trade to be released at 10:00am EST: +1.0% (estimate)
Happy trading!
Tom
