Market Recap for Friday, August 11, 2017
Here's a fact: The benchmark S&P 500, along with all the major U.S. indices, had a rough week last week. Traders aren't used to weekly declines of more than 1%, yet that's exactly what we got last week. The S&P 500 lost 1.43%, its second worst week since the November 2016 uptrend began. Based on that alone, it's difficult to grow overly bearish as buyers have seemed to step up the past ten months no matter what the crisis. This time could be different, however, as we're faced with seasonal headwinds in August and September and weekly momentum (MACD) has been flashing warning signs since the May breakout to fresh all-time highs.
The following chart highlights the negative divergence that we need to be aware of:
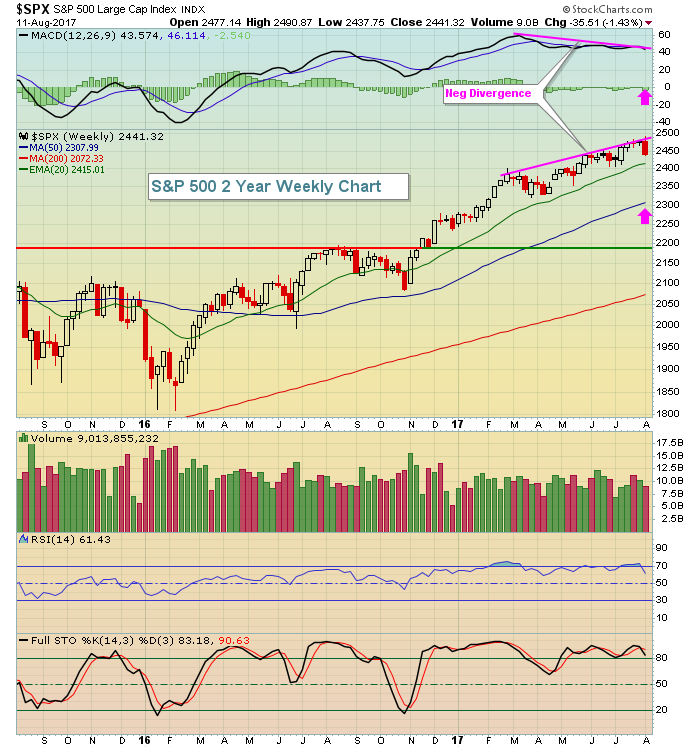 The pink arrows mark the MACD centerline and the 50 week SMA, two levels that I look to be tested following a weekly negative divergence. It doesn't always happen so it's not a guarantee. But I view the market as much riskier when a negative divergence is present simply based on experience. I believe the S&P 500 will grow much more precarious if it closes beneath its rising 20 week EMA
Technology (XLK, 0.69%) led the bounce on Friday in terms of sector leadership, but the only sector to end the week with gains was consumer staples (XLP, +0.18%) and the XLP represents a defensive group of stocks. To the downside, financials (XLF, -2.60%) and energy (XLE, -2.59%) were hit the hardest last week. In order to feel good about the market action in the near-term, we need to see another breakout to all-time highs on heavier than normal volume and with leadership from our aggressive sectors - technology, consumer discretionary, industrials and financials.
Pre-Market Action
Gold ($GOLD) and crude oil ($WTIC) are set to open the week with minor losses as global equity markets rally after stumbling last week. In Asia, we saw mostly higher prices and the key European markets are all higher this morning. The German DAX ($DAX) is particularly strong, rising 1.16% at last check. That should help to provide a lift to U.S. equities and, so far, it has. Dow Jones futures are up 100 points with a little more than 30 minutes to go before we're off and running with a new trading week.
Current Outlook
Given the strength in U.S. futures this morning, I'd keep a close eye on the 5865-5870 area on the NASDAQ 100 ($NDX). This has been a leading index in the U.S., but recently has run into technical struggles. So this is the index I'll be watching closest. First, realize that the declining 20 day EMA is at 5869. After breaking below this key moving average, it becomes a very important test of resistance. On the intraday, 10 minute chart, this is what the NDX looks like:
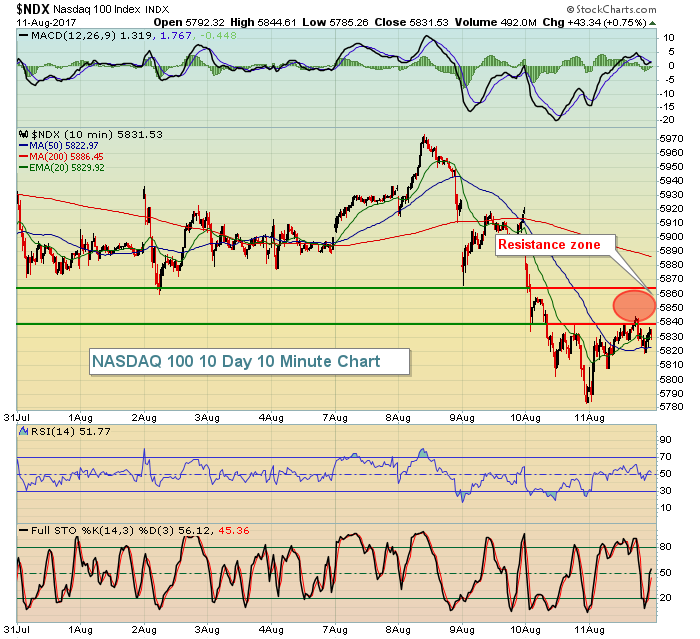 Let's see if we can clear this resistance zone first. If so, we have a shot for further short-term gains. If not, expect the selling to intensify once again this week.
Sector/Industry Watch
Energy (XLE) just can't get going. After breaking above its key 20 day and 50 day moving averages, it's returned to recent lows and threatening yet another breakdown. The bullish positive divergence has played out with price movement back to and above its 50 day SMA and its MACD briefly crossed its centerline for a "reset". But normally, if the positive divergence marks a bottom, pullbacks typically hold the rising 20 day EMA and we then push to new highs and begin a series of higher highs and higher lows. That didn't happen. Instead, the bulls will tested this week as the Friday close was literally on key price support:
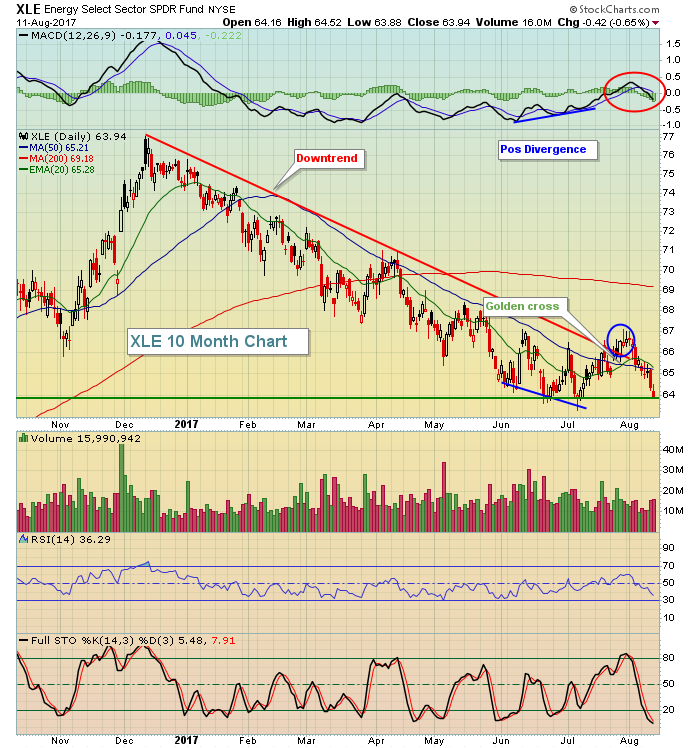 The performance of the XLE since the early July low perfectly illustrates the importance of price over the secondary importance of trend lines. The downtrend line was clearly broken in late August, but the June highs (blue circle) near 67 was never cleared. That failure resulted in a renewed selling effort and now we'll see if the bulls are up to the challenge this week.
Monday Setups
Each week, I provide one setup for the trading week, highlighting key areas of price support and resistance with levels to watch in terms of targets and stops. This week I'm looking at Universal Display Corp (OLED), which reported excellent quarterly results about ten days ago. After the report, OLED remained in its current trading range. Recent trips lower to the 108-110 range have been met with buyers and Friday's intraday move down to 108.15 was no exception. Here's the chart:
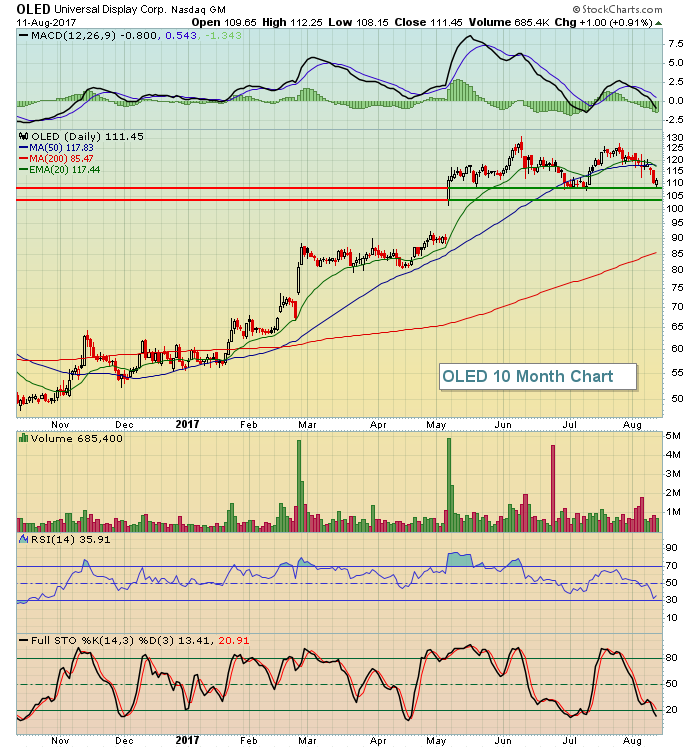 That extremely heavy volume in early May accompanied the prior quarterly earnings of OLED. While we didn't see a breakout with the most recent report, I love this sideways consolidation as OLED likely prepares for its next push higher. Best entry is in the 104 (top of gap in early May) to 108 (recent price support). Current price isn't a bad level for initial entry, but I'd only consider a half entry with second entry either at 108 or 104. My target would be the recent candle body highs in the 127-128 area. Consider a closing stop beneath 101.
Historical Tendencies
The 11th to the 18th of the calendar month tends to be bullish as the market anticipates, then enjoys, the next round of incoming money flows in the middle of the calendar month. On the S&P 500 (since 1950), this 8 day stretch has produced annualized returns of +13.75% - more than 50% higher than the overall +9% return that the S&P 500 has enjoyed throughout the years over the past seven decades. So there's clearly a bullish bias during this period. The August 11th to 18th period has produced annualized returns of +10.89% - not quite as strong as this period in other calendar months, but still better than that average annual S&P 500 return of 9%.
Key Earnings Reports
(actual vs. estimate):
JD: .02 (estimate - couldn't find a comparable actual number)
SYY: .72 vs .71
WBMD: .43 vs .41
(reports after close, estimate provided):
SBS: .25
Key Economic Reports
None
Happy trading!
Tom
