Market Recap for Thursday, August 3, 2017
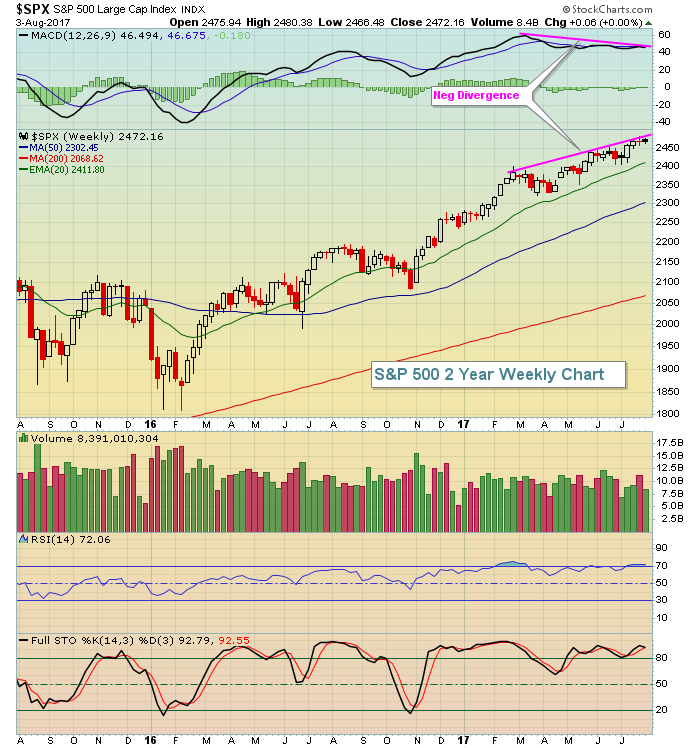
The Dow Jones was once again able to eke out a meager 9 point gain to establish yet another record closing high, but other indices were unable to keep up. The more aggressive Russell 2000 and NASDAQ fell by 0.54% and 0.35%, respectively, and the benchmark S&P 500 also fell 0.22%. Over the past two weeks, the S&P 500 has traded in a very narrow 1% range established by the high and low on July 27th. The S&P 500 is basing in sideways consolidation fashion following an uptrend - and that's generally bullish. However, let's keep in mind that all of our major indices are showing wear and tear on their long-term weekly charts in the form of negative divergences. Here's the reminder:
 On Thursday, leadership came in the form of industrials (XLI, +0.50%) and utilities (XLU, +0.50%), an unlikely combo. Waste & disposal services ($DJUSPC) were strong and are featured below in the Sector/Industry Watch section. On the flip side, energy (XLE, -1.40%) returned to the basement after failing on multiple occasions to clear price resistance at 67.00 on a closing basis. The weakness also took the XLE beneath its rising 20 day EMA, not a great sign for those looking for renewed relative strength out of energy.
Pre-Market Action
Market participants have been waiting for the July jobs report with bated breath to see how both the bond and stock markets react. Well, the jobs data was better than expected so if we see a close in the red today, it'll likely be another case of "buy on the rumor, sell on the news". We've seen that often on NASDAQ stocks with earnings recently so don't rule it out with the jobs report.
The bond market is yawning with the solid jobs report. The 10 year treasury yield ($TNX) is higher, as you'd expect with solid economic news, but it's only higher by a couple basis points and continues to meander around 2.25% - close to one month lows.
The dollar is showing strength in early action, but that could put a halt to the recent Dow Jones outperformance, as explained below.
At last check, and with just over 30 minutes left to the opening bell, Dow Jones futures are higher by 56 points.
Current Outlook
The tumbling U.S. Dollar ($USD) is a profit maker for Dow Jones stocks as these are all very large, multi-national stocks that do a ton of their business in foreign markets. A rapidly declining dollar can result in huge currency translation gains when those foreign profits are converted into U.S. dollars. The Dow Jones represents the best U.S. index to benefit from dollar declines. One way to view this is to use the correlation indicator as I've done in the chart below:
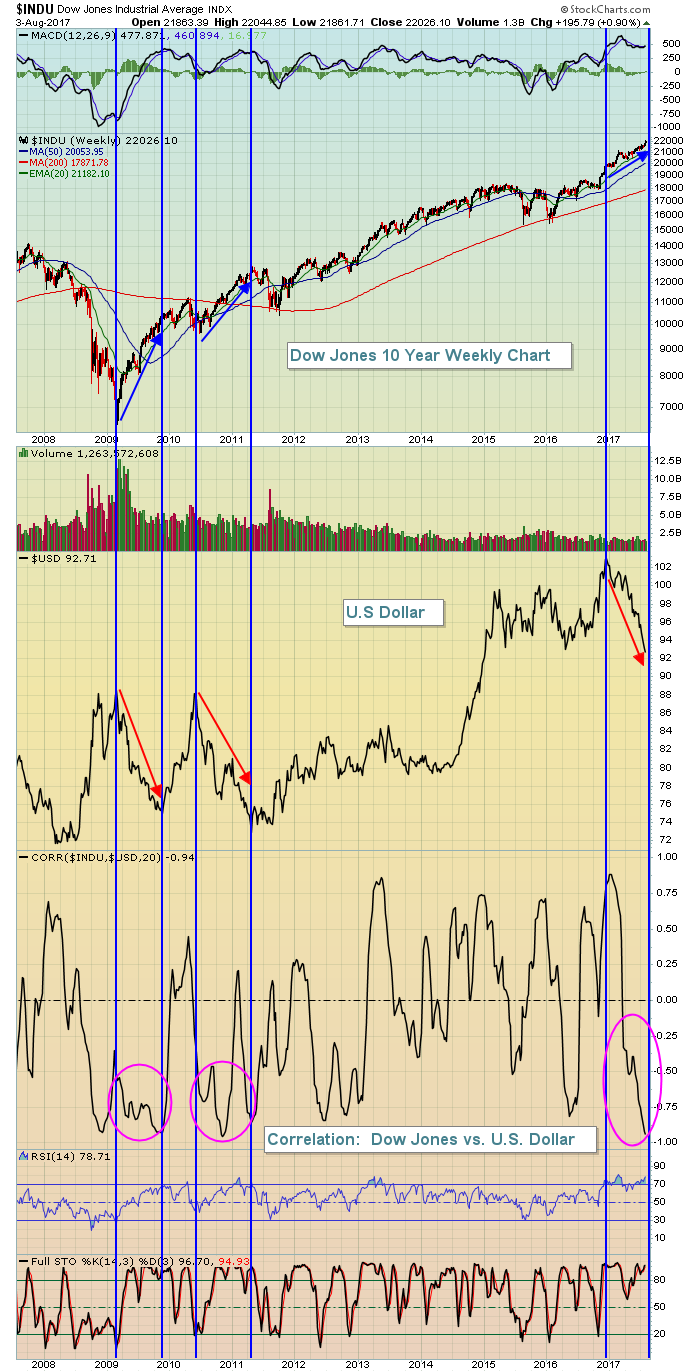 Note that the correlation indicator is buried deep in inverse territory when the dollar falls rapidly. That provides significant dollar-related tailwinds for Dow Jones stocks and helps to provide an explanation currently for why the Dow Jones is suddenly performing so much better than the other major indices. The Dollar Index ($USD) has found support in the 92-93 range on prior tests there in 2015 and 2016 and may do so again. If it does, I'd bet the Dow Jones outperformance trek is taking its last few gasps.
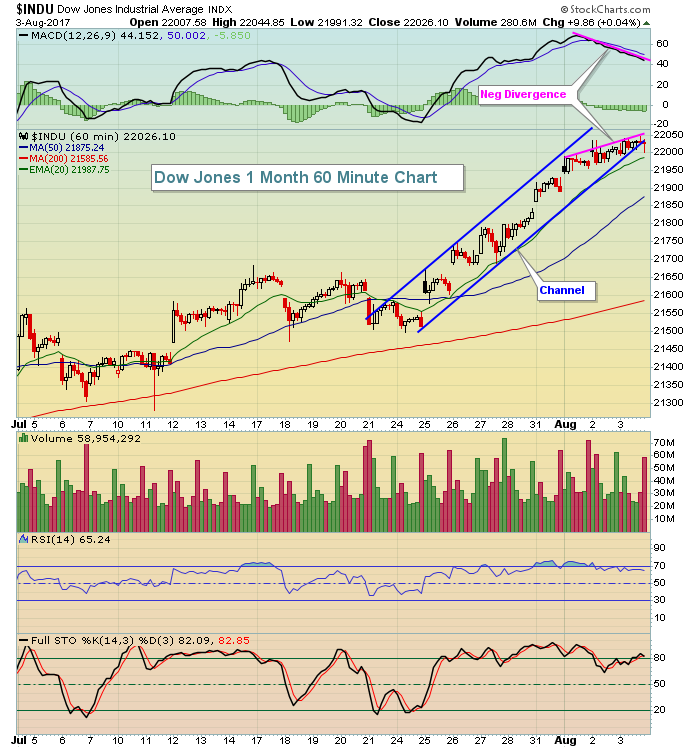
It also should be mentioned that the Dow Jones, like the other major indices, is currently printing a negative divergence on its weekly chart and intraday highs the past two sessions have produced a short-term negative divergence on its 60 minute chart as well. Check this out:
 In pre-market action this morning, jobs came in better than expected so we're likely to see U.S. stocks on the move higher in early action once again. We've watched on several occasions in the past couple weeks where good news has been well-received at the open, only to watch gains fizzle throughout the balance of the trading session. If that occurs today with the Dow Jones negative divergence in play, we could see the selloff accelerate into the second week of August.
Sector/Industry Watch
Ever heard the saying "one man's trash is another man's treasure"? Well, I guess that somewhat applies to the Dow Jones U.S. Waste & Disposal Services Index ($DJUSPC). From a technical perspective, you've got to love the ascending triangle pattern that's evolved following the prior uptrend. Check it out:
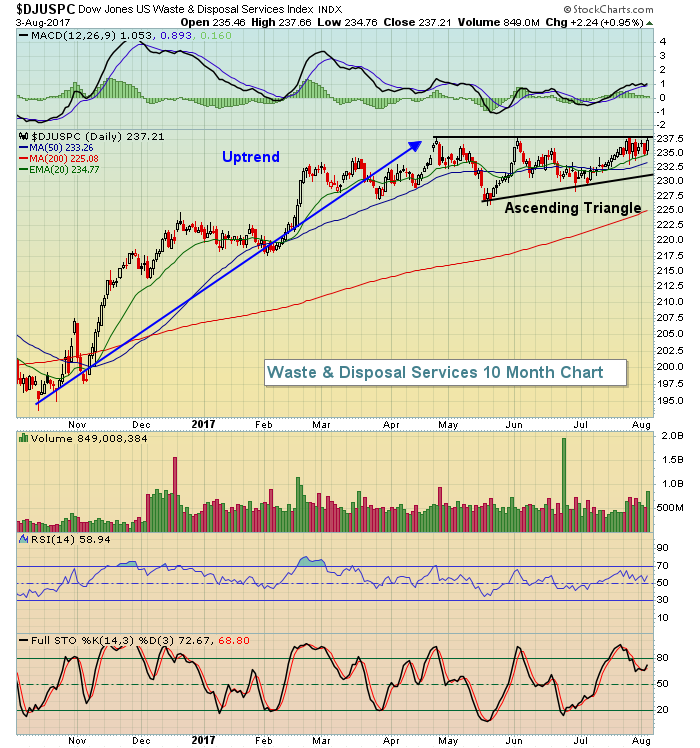 The DJUSPC was one of the leading industry groups yesterday, but fell short of breaking out. More consolidation may be needed, though a trip back to 231-232 could represent an excellent reward to risk entry into this space.
Historical Tendencies
Yesterday, I pointed out that J.B. Hunt Transports (JBHT) has significant seasonal issues during the August-September period. It's not isolated to just one trucker, though. Take a look at the performance of truckers ($DJUSTK) relative to the benchmark S&P 500:
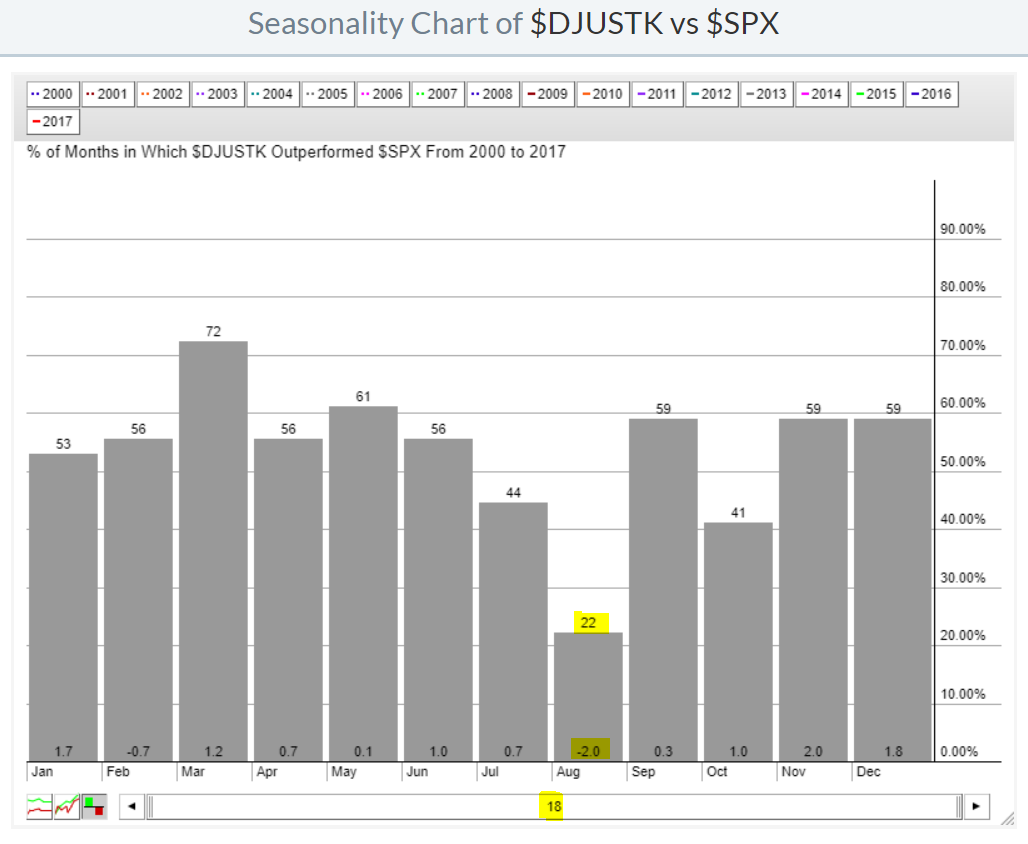 While truckers have generally enjoyed solid relative performance in most calendar months, August is a clear exception. This chart tells us that the DJUSTK has outperformed the S&P 500 only 22% of the Augusts since the turn of the century. So underperformance this month is the norm - and the underperformance isn't insignificant. The DJUSTK return averages 2% less than the return of the S&P 500 during August. Our conclusion? Lower your expectations for the trucking group for at least the next few weeks.
Key Earnings Reports
(actual vs. estimate):
AON: 1.45 vs 1.45
CI: 2.91 vs 2.48
NWL: .87 vs .86
RBS: .24 vs .14
SRE: 1.10 vs .80
(reports after close, estimate provided):
BRK.B: 1.85
Key Economic Reports
July nonfarm payrolls released at 8:30am EST: 209,000 (actual) vs. 178,000 (estimate)
July nonfarm private payrolls released at 8:30am EST: 205,000 (actual) vs. 175,000 (estimate)
July unemployment rate released at 8:30am EST: 4.3% (actual) vs. 4.3% (estimate)
July average hourly earnings released at 8:30am EST: +0.3% (actual) vs. +0.3% (estimate)
Happy trading!
Tom
