SPX Monitoring purposes: Sold SPX 7/5/19 & 2990.41= Gain of 2.50%; Long SPX 6/25/19 at 2917.38.
Monitoring purposes GOLD: Long GDX on 1/29/19 at 21.96.
Long Term Trend SPX monitor purposes: Sold SPX 7/5/19 & 2990.41= gain 2.63%; Long SPX on 6-26-19 at 2913.78.
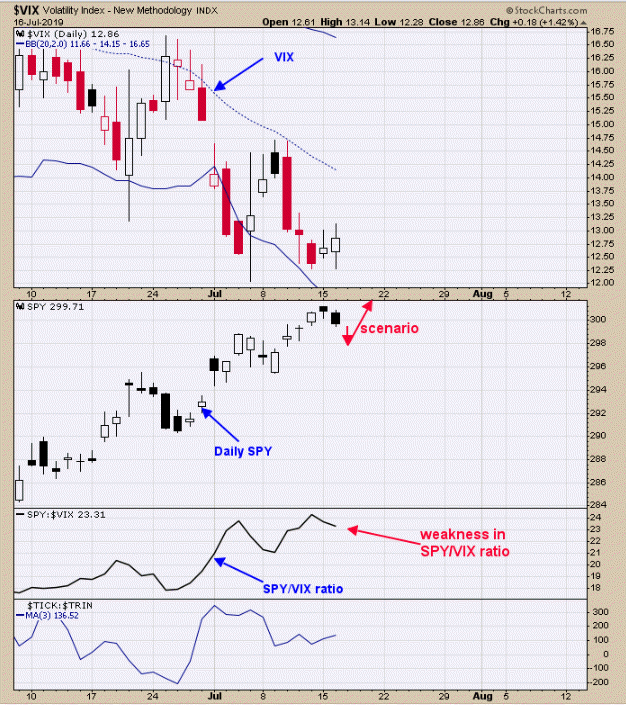
 Above is the VIX, which trades oppositely to the SPY. The second window up from the bottom is the SPY/VIX ratio. This ratio is bullish for the market when it is rising and bearish when declining. The ratio turned down yesterday and continues down today, a bearish sign. However, we don’t expect the market to decline much more. Yesterday, we said “Today the markets are 5 days up in a row, market higher within 5 days 93% of the time with an average gain of .93% (@usarlewitz). Therefore if there is a pull back and panic is recorded, a bullish setup could form. This is options expiration week, which has a bullish bias.” Today's panic was recorded in the TRIN with a close of 1.57; if TICKs close below -100 tomorrow, a bullish setup could develop.
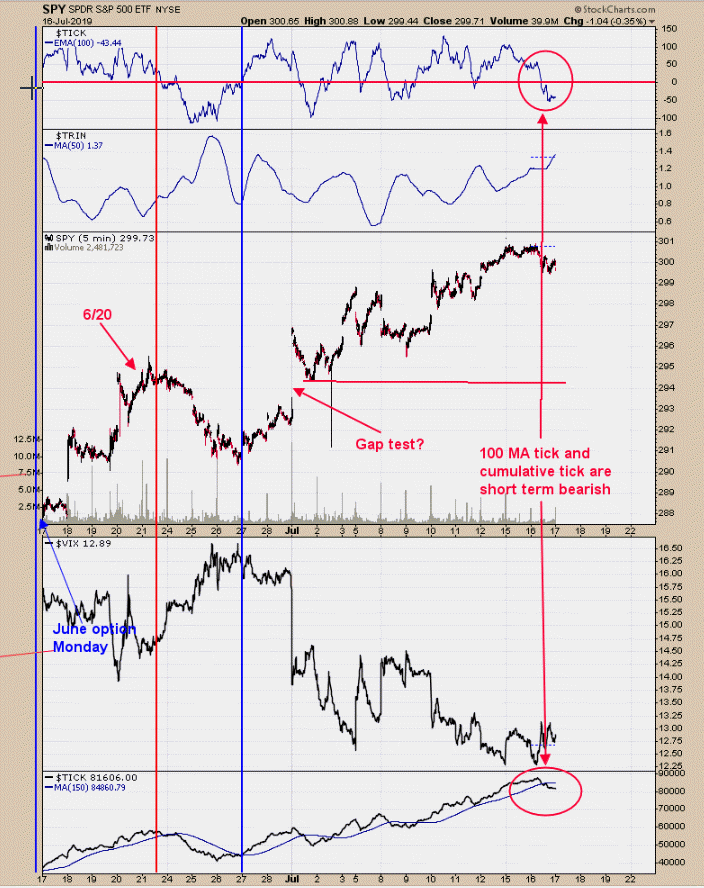
 The bottom window is the cumulative TICK. It's bullish when rising and bearish when declining. Today, it fell through its moving average, a bearish sign. Top window is the 100-period moving average of the 5-minute TICK. Readings above “0” are bullish and below are bearish. Today, the TICK fell below “0”, a short term bearish development. The TRIN closed today at 1.57 and yesterday at 1.34, which adds up to 2.91. Two-day TRIN that add up to 3.00 or better can produce bounces in the market. A reading of 2.91 is very near the bullish level. (Sold SPX 7/5/19 & 2990.41= Gain of 2.50%; Long SPX on 6/25/19 at 2917.38.
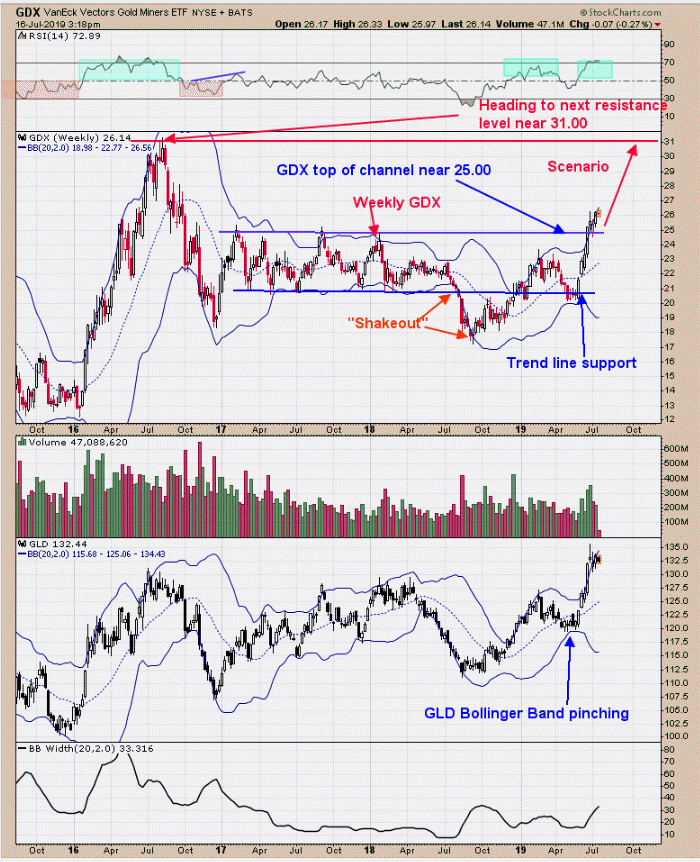
 Above is the weekly GDX chart going back to late 2015. A trading range developed in 2017 that bounced around from 21.00 to 25.00. GDX fell below 21.00 (the bottom of that trading range) in 2018 and then closed above it in early 2019, creating a “Bullish Shakeout.” GDX traded back to support near 21.00 in May and, from there, closed above the top of the trading range, near 25.00. Now, the 25.00 range should act as support. Going forward from here, the market may attack the next upside resistance, which is the 2016 high near 31.00. For now, that's our upside target. Long GDX on 1/29/19 at 21.97.
Tim Ord,
Editor
www.ord-oracle.com. New Book release "The Secret Science of Price and Volume" by Timothy Ord, buy at www.Amazon.com.
