“Using Longer Term Charts Along With Certain Indicators Will Provide Insight and Perspective.”
It’s been a tough couple of days for the markets with declines (before today’s open) over the last 6 days of trading amounting to 6% for the S&P 500 and 7% for the more concentrated Dow Jones Industrial Average. And based on the price action into the close today, the markets appear to be headed toward further downside tomorrow.
While all of this has some investors in a panic mode – Vanguard’s client computer servers apparently crashed yesterday with all of the increased traffic – it’s at times such as this that keeping a cool head will serve you well. Selling your stock in a panic is an emotionally based action that is generally not a good idea when investing. Instead, let’s use history as a guide to gain perspective on the current action and help you formulate a plan for going forward.
As a starting point, it helps to understand whether the current stock market downtrend is heading toward a possible correction or even worse, a bear market. Both of these market types have different durations and percent declines and having this information will assist you in knowing what to expect going forward.
Of course, things can change in a flash but as of today, the markets are pulling back following a strong, recent run up. Pullbacks are generally between 5%-8% and the action surrounding the pullback is orderly enough to suggest that you can buy the stock (or the markets) if you are bullish.
Unfortunately, the recent drop in the markets has been anything but orderly and general sentiment based on price action and recent comments from economic “figure-heads” suggests that the near-term bullishness from earlier in the year has evaporated. In addition, yesterday’s price action points to a lower open today as the late-day rally attempt was met with major selling.
Should the markets drop more then 8% then we could be entering a market correction. On average, market corrections last 8 weeks and declines during this period are between 10% - 15%. During this 8-week period, you’ll see several attempts to reverse the downtrend but using the link to a second article below you can learn how to correctly spot when the downtrend in the markets has ended.
Lastly, we need to define a bear market which is not a common occurrence but when it unfolds, it can be deeply painful. Bear markets are when a major index is down at least 20% for more than two months but the bad news is that on average this market type can last 10 months with declines around 35%.
For those of you that are now worried, it’s important to know that bear markets occur around major events such as the 2008 collapse of the banking industry or the 2001 technology bubble. At this point, economic growth and mostly normalized multiples in stocks (particularly since the recent selloff) would not have us looking for this catastrophic occurrence.
Below is a monthly chart of the S&P 500 and as you’ll see, I’ve highlighted the technical action in a bear markets vs a correction. Earlier in the chart we can see the beginning of the 2008/2009 bear market and I’ve used the RSI on the top and Stochastics below the chart. Both of these tools are momentum indicators and you can access full definitions using these links. (RSI and Stochastics)
MONTHLY CHART OF S&P 500
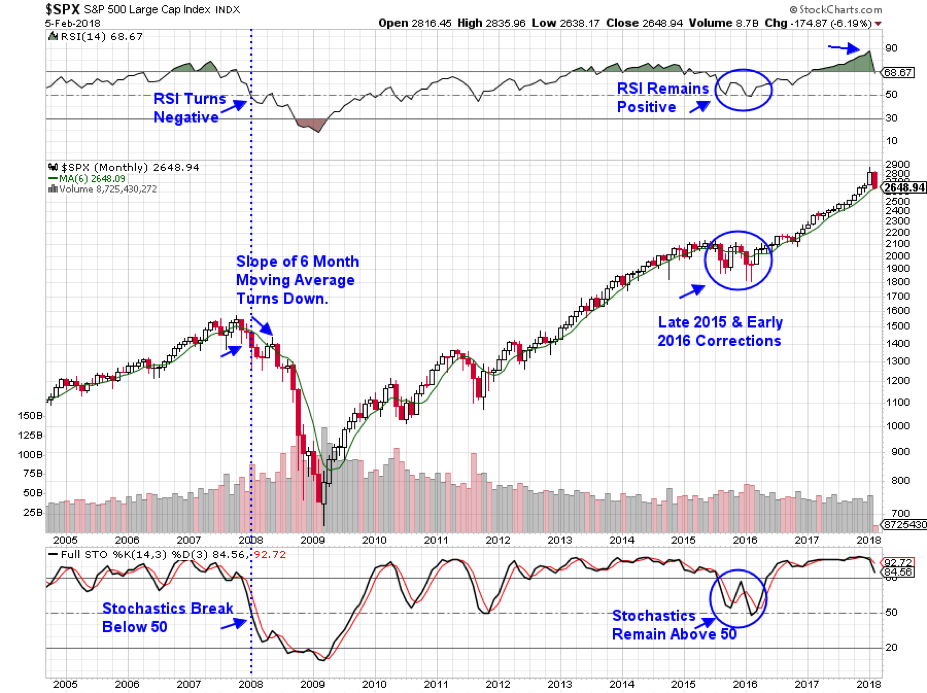
In brief, if the RSI breaks below 50 – which is considered neutral, that is viewed as a negative. Likewise, with the stochastics. As you can see, at the beginning of the 2008 bear market, both of these indicators broke below 50 simultaneously.
Equally important is paying attention to key moving averages and in this chart, I’ve used the 6-month simple moving average which can be very powerful for spotting longer term breaks. You’ll also want to pay attention to the volume on the break and as you can see, the 2008 break below this key MAV occurred on heavy volume which is quite negative.
In comparison, I’ve highlighted the 2 corrective periods from late 2015 and early 2016. Each of these declining periods were much less severe then the bear market with an average decline of 11% from peak to trough. As you can see, the RSI and Stochastics both remained above the critical 50-point and generally, the 6-month moving average did not slope downward.
On the far right, you’ll see that currently the RSI and the Stochastics are well above their neutral 50-line however, things can change quickly particularly in an environment of program trading and a global marketplace which can increase activity.
For now, we appear poised for a correction but of course we’ll keep a close watch on the Indexes vs these key indicators.
In addition to being able to spot longer term trend changes, you’ll want to be able to spot a downtrend reversal of corrections or a bear market. For this you’ll want to use a shorter-term price chart that will be more telling. If you’d like to receive this information, please click this link here and I’ll forward it to you.
p.s. Please note that while there were breaks below the key 6 month moving average in 2010 and 2011, the Index did not close the month in the lowest portion of its trading range which would allow more leeway in the interpretation.
Warmly,
Mary Ellen McGonagle
President
MEM Investment Research