
After a great session this week with Tom and Erin of the StockCharts MarketWatchers program, I am happy to follow up with my first blog article to introduce the XABCD measurement tool we discussed during the program. The XABCD drawing tool is new to the StockCharts platform, and it can outline distinct M-type and W-type harmonic price structures. These price formations represent the structural basis for harmonic patterns that can define unique levels of natural support and resistance.
I initially defined the rules for harmonic patterns in my first book, “The Harmonic Trader” in 1998. In fact, twenty years ago, I was invited to contribute articles to StockCharts.com and I would like to personally recognize the website as an important platform for me to present these initial ideas. My articles on StockCharts at this time introduced many of the initial harmonic discoveries that have now become common knowledge within the trading community. Incredibly, the harmonic measurement strategies have been embraced throughout the trading industry as more individuals apply these effective pattern recognition strategies to their existing arsenal of tools. In doing so, traders quickly realize the unique relationships that these price formations possess. More information on harmonic patterns is available on my website, www.harmonictrader.com Furthermore, I will be contributing more information and resources to learn about the foundation of harmonic pattern measurements strategies soon.
In today's blog post, I would like to focus on the new XABCD tool, how to access it and apply immediately to your chart analysis. For starters, I would like to refer you to the interview with Tom and Erin of the stock charts market watchers program where we discussed the new tool and reviewed several harmonic XABCD patterns currently unfolding in the markets.
Access the link: https://www.youtube.com/watch?v=DwcbG33G4lM
To review, I would like to show how to access the tool and then how to apply it to current chart analysis. First, access the XABCD tool by clicking The ANNOTATE button for the market being considered. Let’s review Baker Hughes – a stock we discussed in the session. The following shows the chart in ANNOTATE mode (left corner) with the XABCD highlighted with an arrow pointing to the W-Type harmonic price structure.
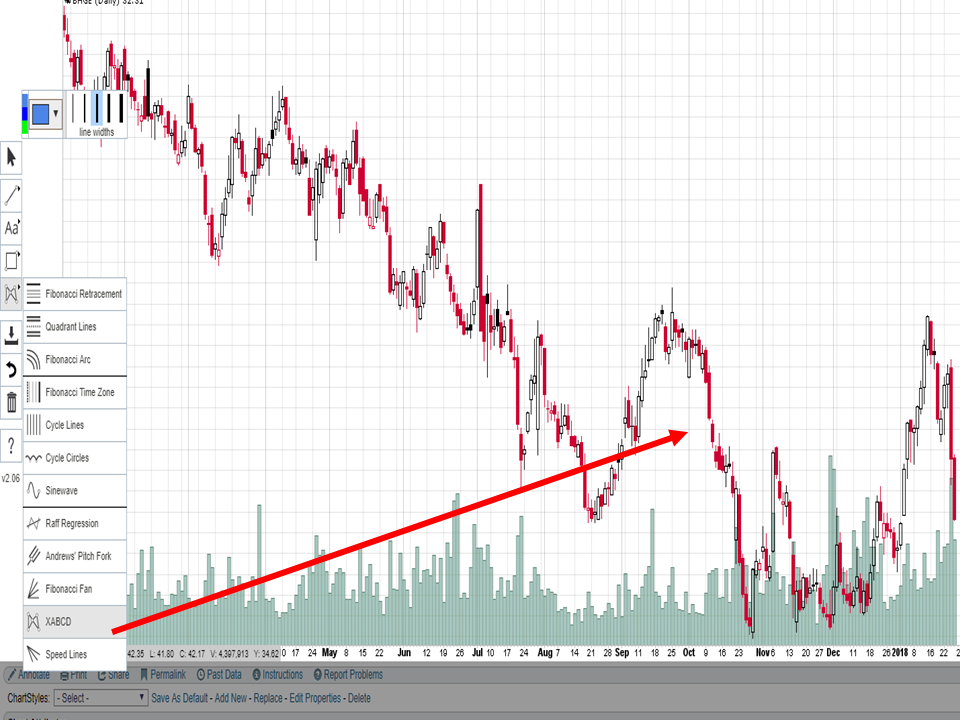
After opening the screen in ANNOTATE mode, the interactive screen will open where the user can illustrate their charts and save the analysis for later. Click the icon that is in the middle of the drawing tool bar menu and select XABCD icon. Once selected, look for price action that has an M or W structure with distinct high and low points that follow the structural rules outlined in the presentation. Simply, click the initial point to begin marking the structure and select each subsequent A, B, C and D points to mark the M or W formation. For the Baker Hughes example, we start with the recent high a few months ago back in September.
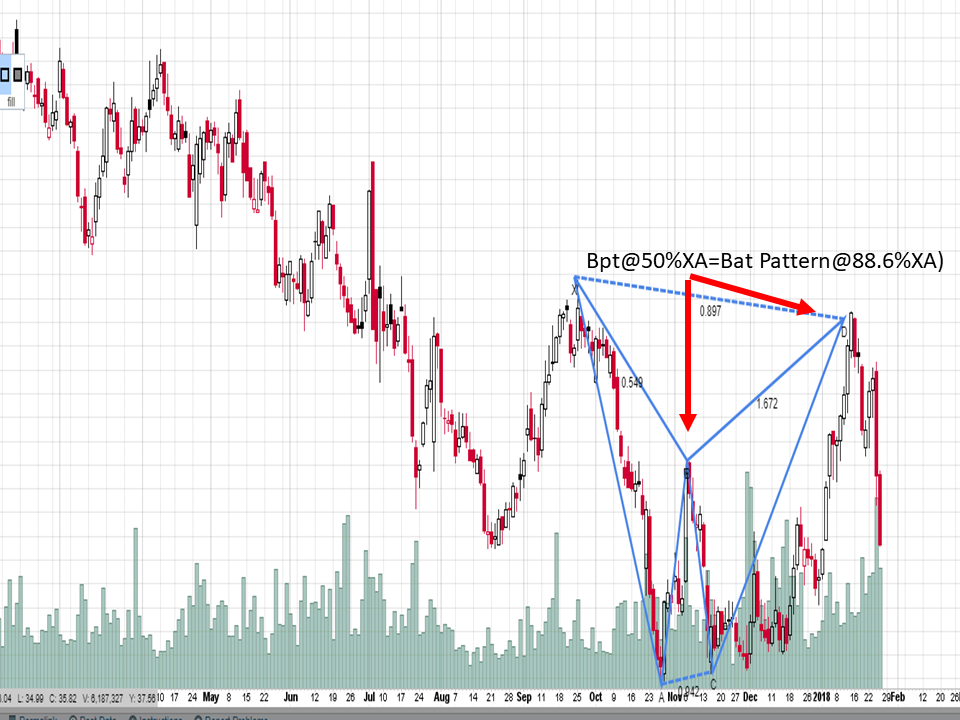
Although some basic knowledge is required to understand each pattern structure, we can simply look at the midpoint to determine what pattern type we are analyzing. We analyzed this formation in the chart of Baker Hughes during the presentation, outlining a Bearish Bat pattern. Although there are other considerations that are essential in the analysis of harmonic patterns, the basic identification strategies are extremely useful in differentiating each type. Starting with the midpoint of the structure at B, the general rule of thumb is that the ratio at this area will define the eventual completion for the pattern. This pattern marked important reversal recently and an important continuation with in the downtrend. Looking at the last six months, we see price action consolidated within an established downtrend. After, the daily chart completed the W-Type Bat formation which possessed the ideal ratios for the Bat pattern, the reversal ensued quickly. It is important to note that the B mid-point completes at a 50% level of the XA leg which results in a projected completion/reversal at the 88.6% level. The price action rolled immediately after completing the pattern.
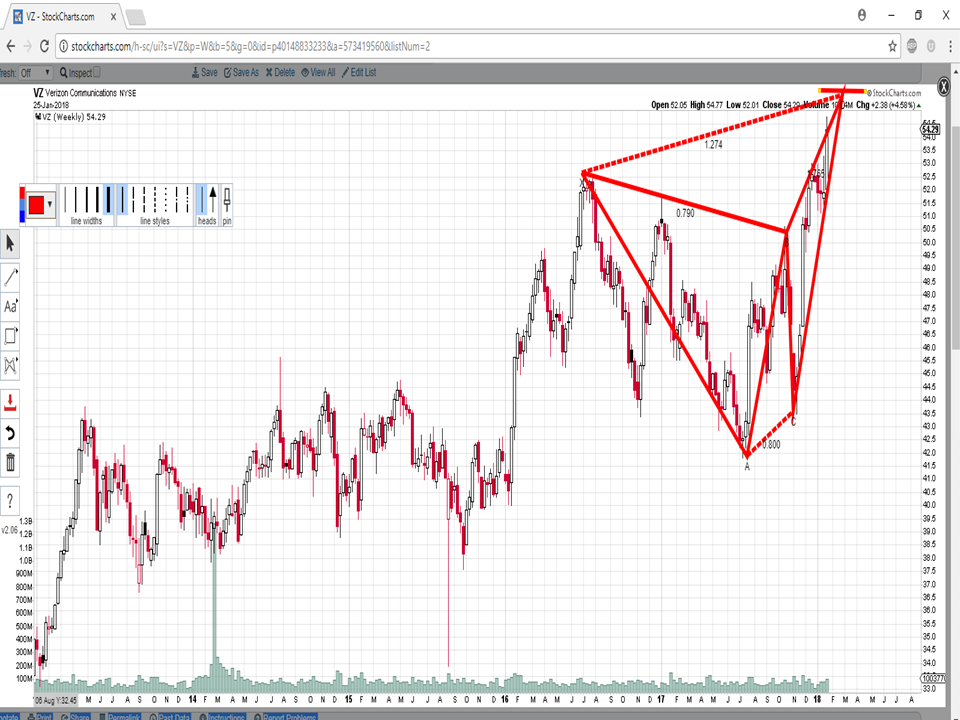
As we discussed in the presentation, the M and W formations are specific formations that must possess a specific alignment of ratios as well as structural points. We analyzed the two basic M and W pattern types: Retracement (Bat, Gartley) and extension (Butterfly, Crab). The following weekly example in Verizon (VZ) possesses an ideal Bearish Butterfly target the area just above the $56 level as an important resistance point within the downtrend. At a minimum, we can utilize the projected pattern completion as a target for long positions to take profits and/or look to go short. For now, the trend is still up until the structure has completely tested all of the harmonic measures that define the pattern.
I will post more information regarding harmonic patterns and how to best integrate them into your trading analysis. At least now, we have an essential tool that can begin to enhance this analysis and sharpen measurement capability with powerful XABCD harmonic patterns. Finally, I look forward to sharing more information about harmonic pattern strategies to the StockCharts community. Great to be back!