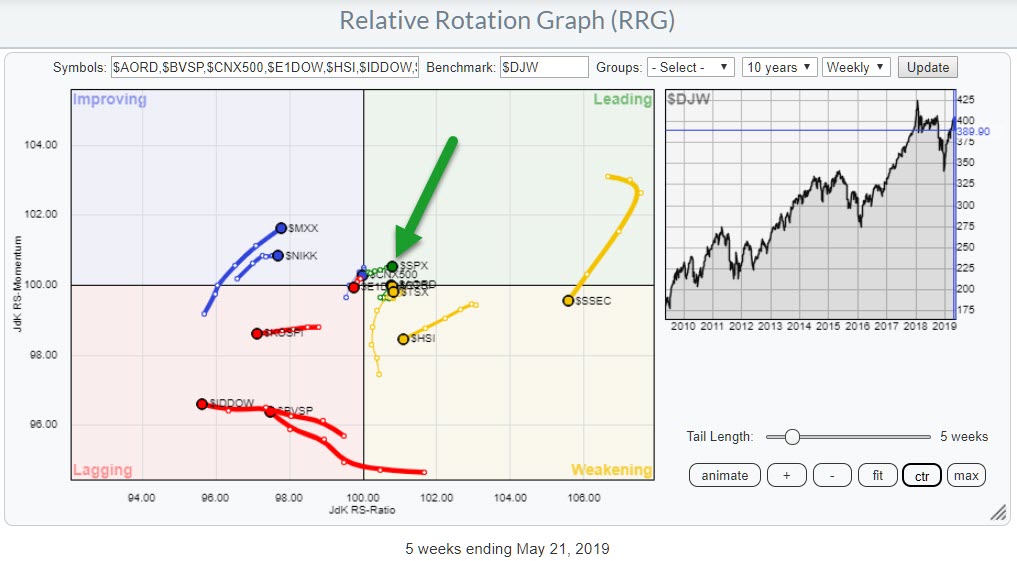
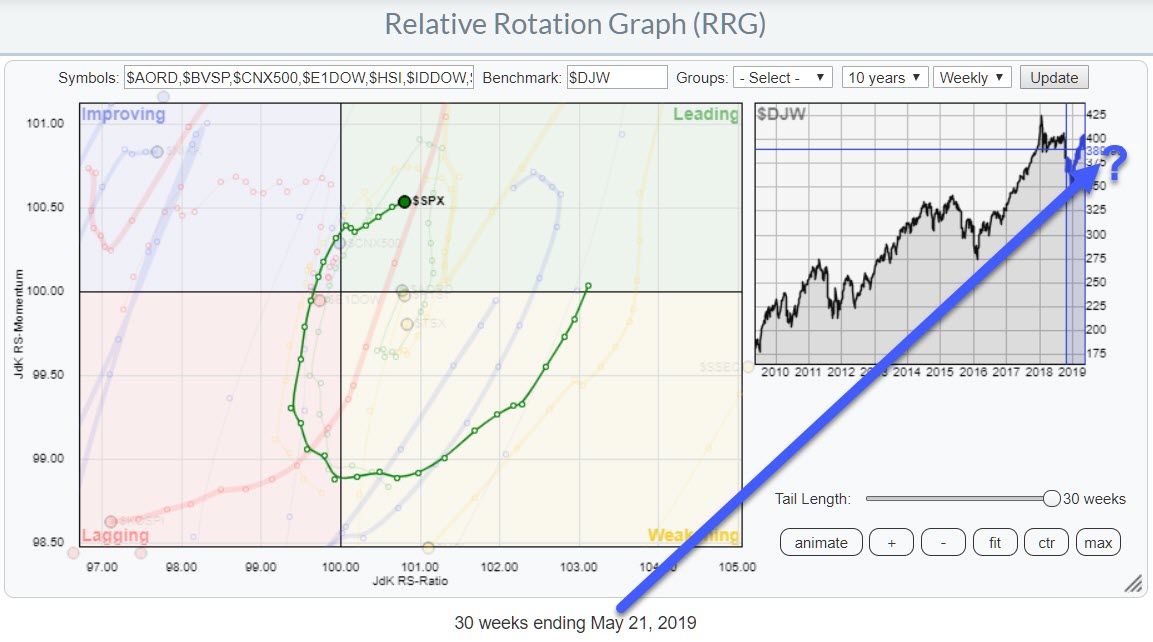
 Stock markets around the world are giving mixed signals. Returns over the last 5 weeks have varied from +4% in Australia to -10% in China. The Relative Rotation Graph above shows the relative trends that are currently in play among the various international stock market indexes.
For a pure, and thus better, comparison of the various (trends in) performances, I use INDEXES instead of ETFs. If you want to read or re-read more about the reason why, please take a look at this article.
When I started to study the tails for various indexes in the RRG above, I noticed that the RRG-heading for the US market ($SPX) was in the strong 0-90 degree area while inside the leading quadrant. That means that the relative trend for $SPX is strong compared to the Dow Jones Global Index ($DJW) and a lot of other markets.
Although I like to think that I know how to read RRGs pretty well, this observation still came across as quite strange to me.
Why Strange?
Let me try to explain. This has to do with my long-term take on the US stock market, which I'm basing on the monthly chart printed below.
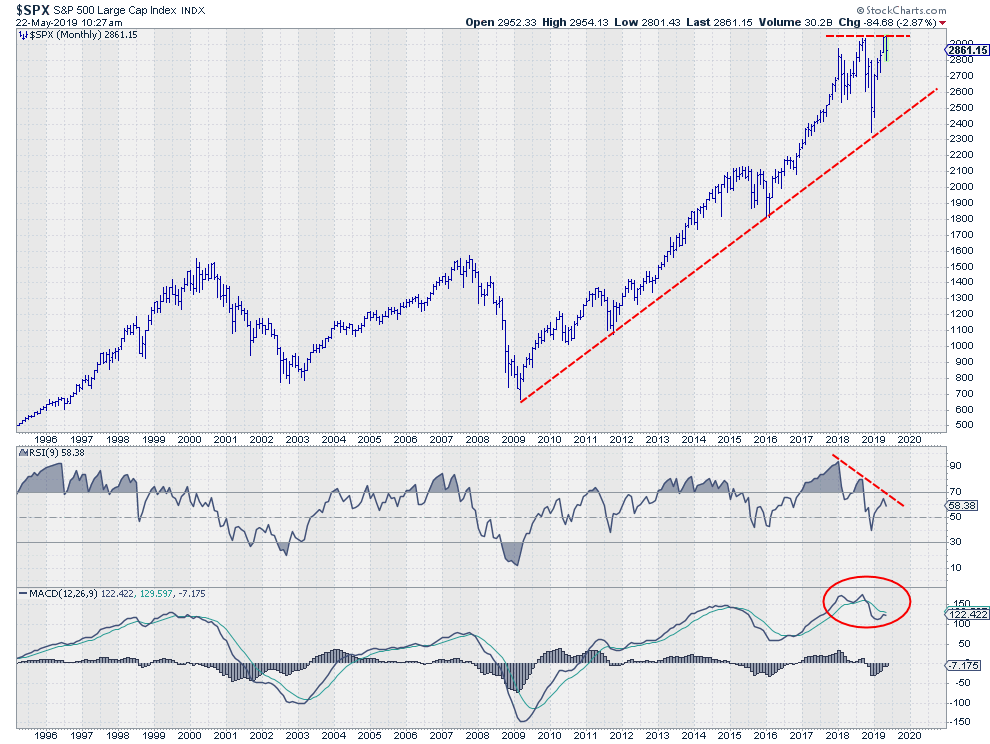 When the S&P failed to break beyond its former high, the market structure changed significantly (IMHO). The long-term rising trend line out of the 2009 low is still valid, but 450 points (15%) below current levels. That is a serious downside risk that should not be ignored.
When the market failed to break higher, the overhead resistance, which caps upside potential around 2900-2950, got a lot stronger. The strong negative divergence between price and both the RSI and the MACD indicators is sending weak signals, which is something that makes me cautious for the near future. (As this is a monthly chart "future" means at least a couple of months going forward.)
Based on these observations, my reading of this market is that there is (much) more downside risk than there is upside potential, which makes me reluctant to be very bullish.
But The Relative Position Is Strong?
However, as I said at the start of this article, the relative position for US stocks against other world markets is strong.
With a neutral (at best) to negative view on the US market, that observation of positive relative strength against other stock markets can only mean that the technical position of other stock markets is even weaker than the US.
This led me to wonder "What does it mean when US stocks outperform global markets?" or, perhaps a little looser "What does it mean when the US is among the strongest-performing markets in the world?"
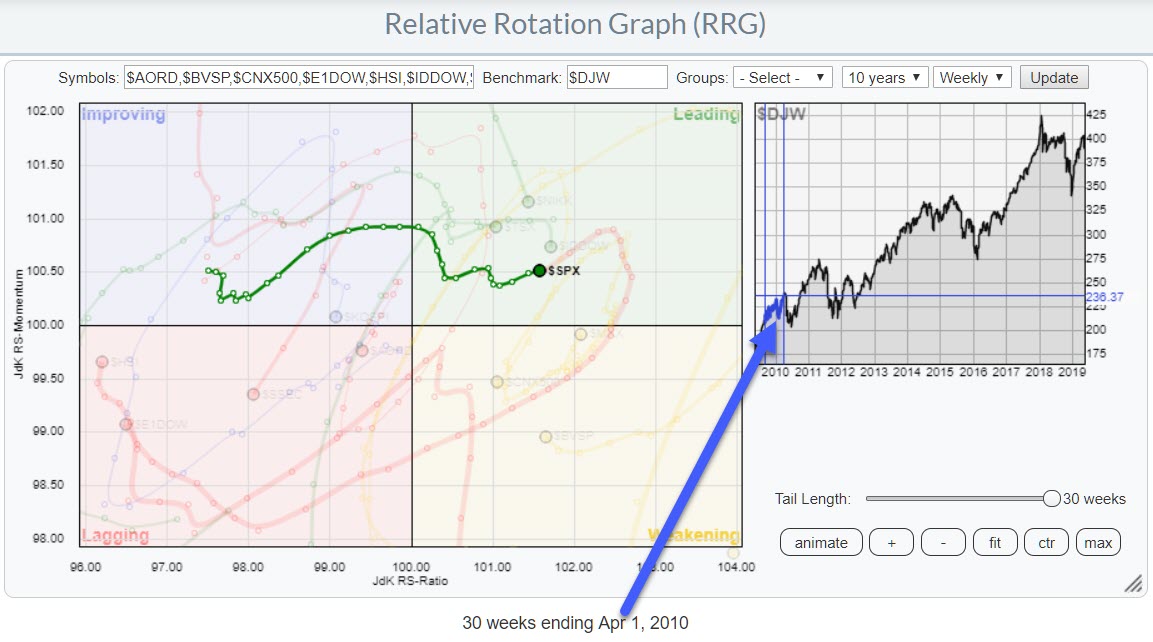
To answer that question, I loaded the RRG at the top of this article with 10 years of history and hit the animate button. While the animation was playing, I paused it every time I arrived at a major peak in the benchmark chart ($DJW). What I noticed that, at most of these events, the US had or started showing improving rotations, while other markets were going the opposite direction.
The way I translate this observation or try to find a rationale for it is that investors probably see the US as a "safe haven" in a way similar to the performance of small-caps vs. large-caps. During bull markets or rallies, small-cap stocks tend to lead, whereas, when weakness comes in, large-caps take over.
Within the Dow Jones Global index, the US makes up almost 50% of the index, so it makes sense for the US to outperform when the market as a whole is starting to decline. It also underscores the fact that small-cap stocks - or, in this case, small(er) cap countries - offer better opportunities for capturing alpha vs. the benchmark and make wider rotations around a Relative Rotation Graph.
The resulting conclusion is thus that a positive rotation of the S&P index in a universe of global stock market indexes is sending a warning signal for the overall stock market performance.
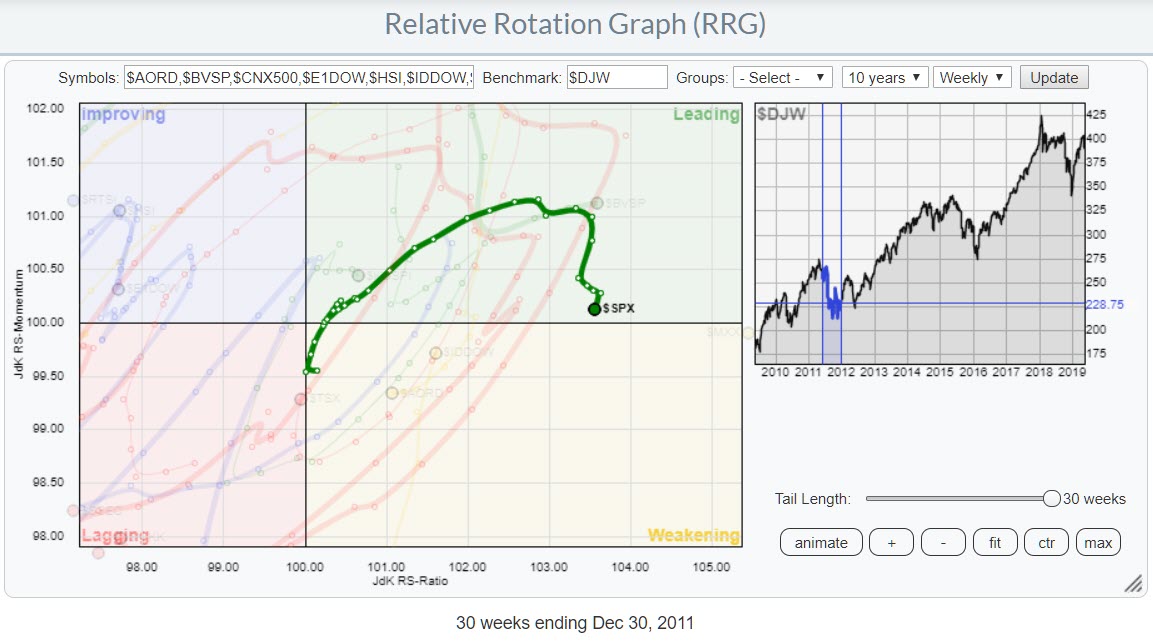
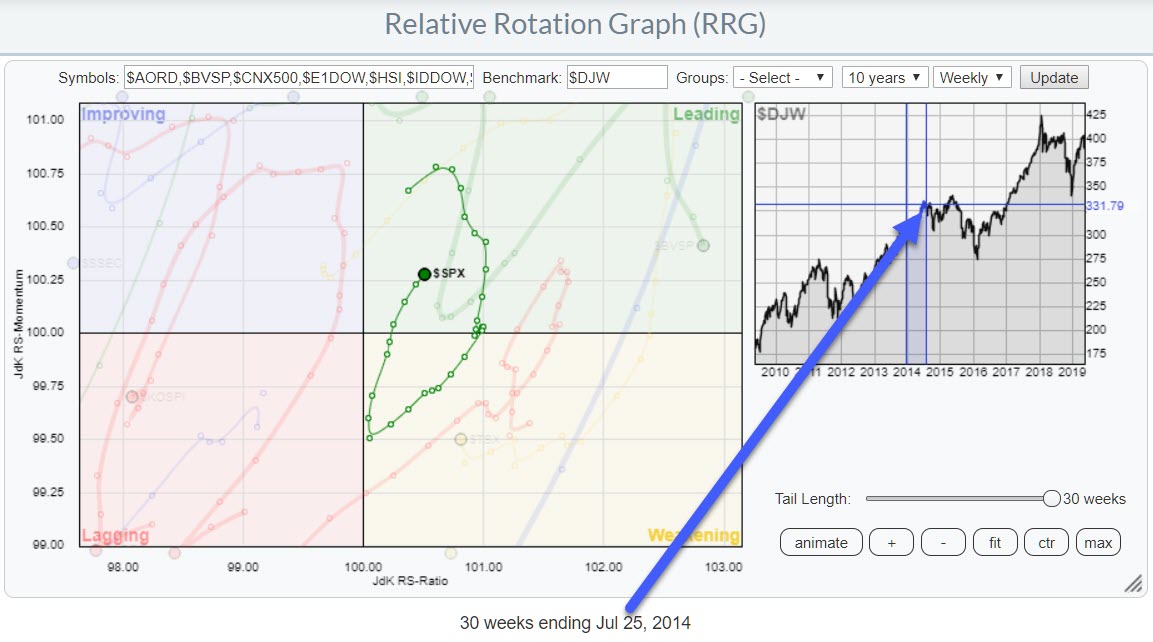
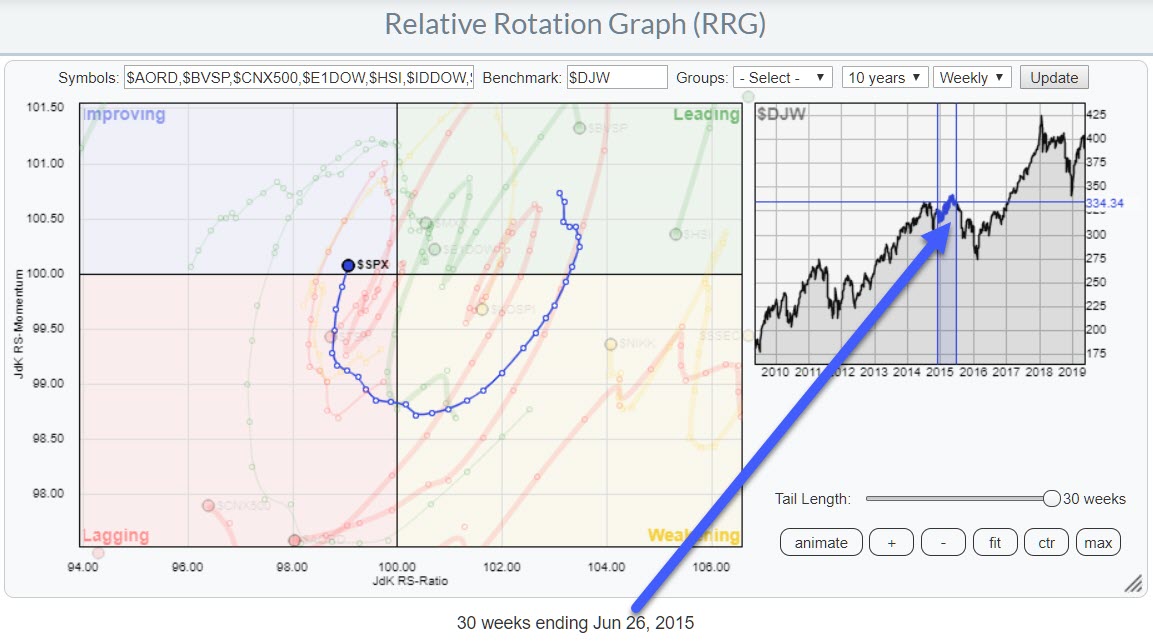
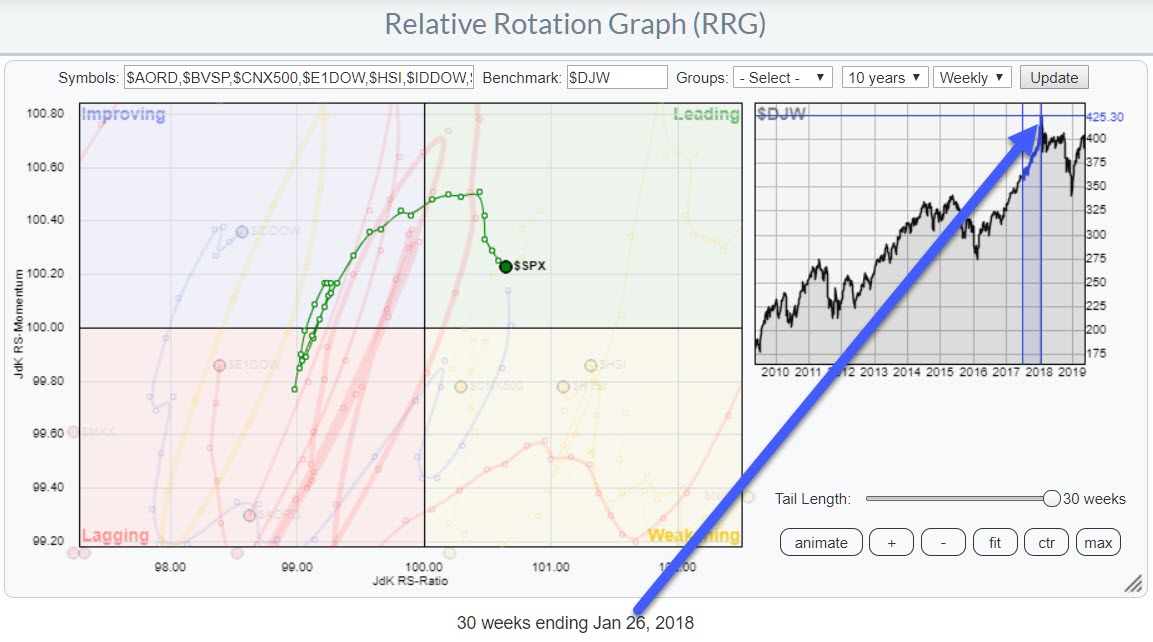
Below are a few snap-shots of the RRG positions at major market tops.
1 April 2010
21 April 2011
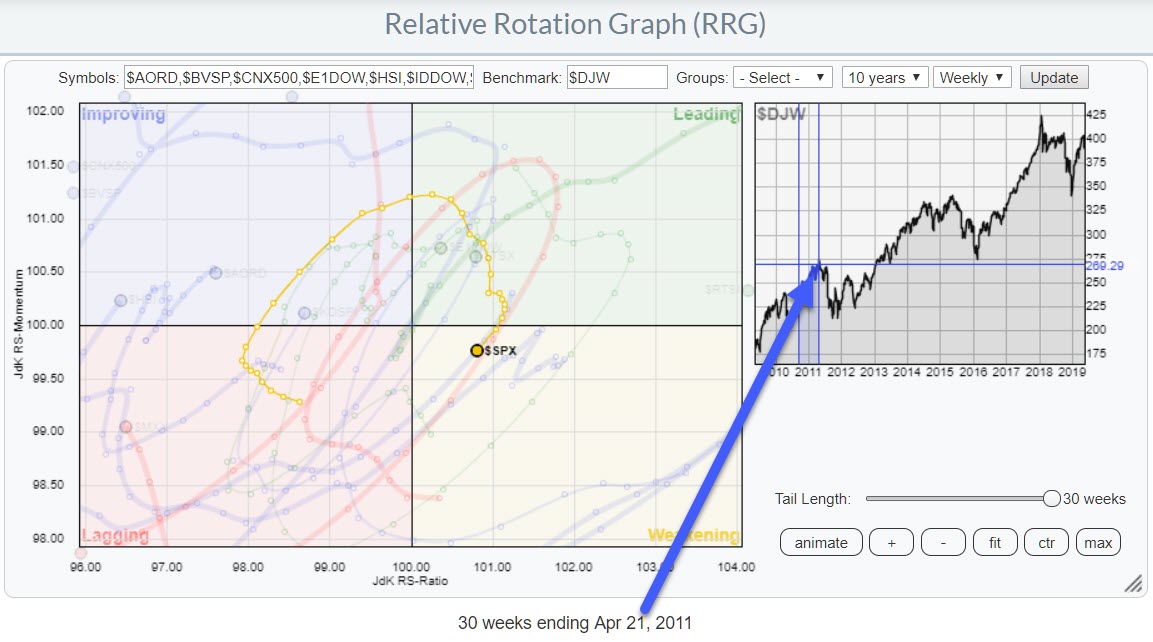 Followed by a rotation at the right-hand side through weakening back into leading during the decline in $DJW.
25 July 2014
26 June 2015
26 Jan 2018
Currently
Be Careful
One thing to watch out for is the fact that the S&P tends to lead or rotate positively against other markets before and during general market declines. This does not necessarily mean that a rotation of the S&P towards or into the lagging quadrant automatically means a decline in price for the S&P!!
MWL On Thursday 23 May
Tomorrow (Thursday 23 May), I will join Tom Bowley and Erin Swenlin for MarketWatchers LIVE, where I am planning to discuss this observation during the show alongside a view on the current state of sector rotation in the US!
Let me know what you think of this usage of RRG in the comments below. If you would like to receive a notification when a new RRG Charts blog article is published, simply subscribe with your email address using the form below.
Julius de Kempenaer
Senior Technical Analyst, StockCharts.com
Creator, Relative Rotation Graphs
Founder, RRG Research
Want to stay up to date with the latest market insights from Julius?
– Follow @RRGResearch on Twitter
– Like RRG Research on Facebook
– Follow RRG Research on LinkedIn
– Subscribe to the RRG Charts blog on StockCharts
Feedback, comments or questions are welcome at Juliusdk@stockcharts.com. I cannot promise to respond to each and every message, but I will certainly read them and, where reasonably possible, use the feedback and comments or answer questions.
To discuss RRG with me on S.C.A.N., tag me using the handle Julius_RRG.
RRG, Relative Rotation Graphs, JdK RS-Ratio, and JdK RS-Momentum are registered trademarks of RRG Research.