After a struggle with resistance around its previous high of 2940, the S&P 500 index failed to break and started to come down off of its highs.
A lot of political and fundamental issues and news are influencing the behavior of market participants at the moment; this uncertainty has resulted in a rally of the VIX index for the time being.
In times like these, people start to look for safe havens, such as (government) bonds - preferably at short maturities - or defensive sectors, but also GOLD.
Scanning some headlines across the internet (and also here at StockCharts.com), I noted an increased interest regarding the price of Gold recently. Martin Pring, for instance, recently wrote about Gold in his Market Roundup article, which you can find here.
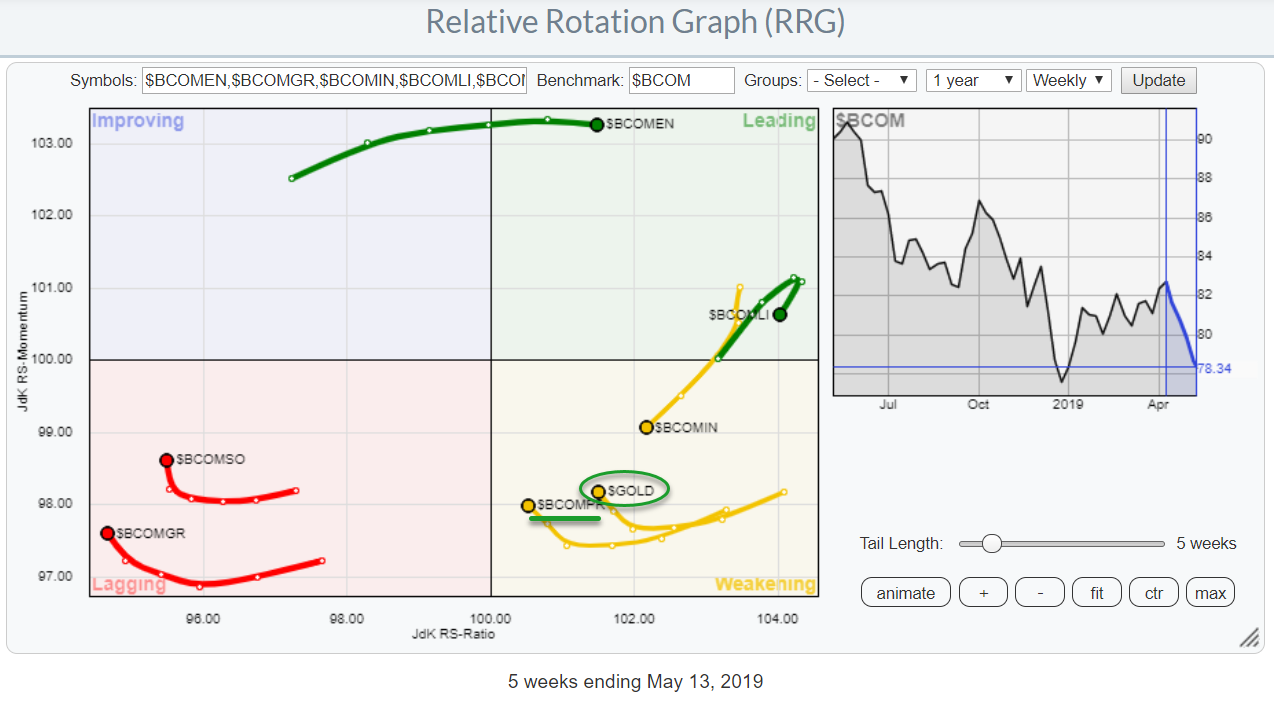
As you know, Relative Rotation Graphs can be used to visualize any universe, as long as you stick to comparing apples with apples and oranges with oranges. So, for this article, I want to focus on the RRG for Commodities and add Gold, which is part of the Precious Metals group, to the mix.
The RRG above shows the rotation of the various Bloomberg Commodity Indexes plus $GOLD against the general Bloomberg Commodity Index. You can find more information about the composition, the breakdown and the weights for this index at this link.
The Energy ($BCOMEN) and Livestock ($BCOMLI) are both inside the leading quadrant, with Energy continuing to do well at high JdK RS-Momentum levels and a steady pace on the Jdk RS-Ratio scale. This indicates a stable trend in outperformance that is still ongoing.
Livestock shows a rapid rotation towards the weakening quadrant. Despite the fact that this is still the strongest group measured on the JdK RS-ratio scale, this rotation suggests some weakness ahead, at least for the near term.
Precious Metals
On the RRG for commodities against the general commodity index, Precious Metals is inside the weakening quadrant following a strong rotation through leading.
The Precious Metals group entered the leading quadrant in December last year and continued to push higher on the RS-Ratio axis until March, when it started to roll over and lose momentum. This resulted in a crossover into the weakening quadrant, where it still is today.
However, as you can see, the tail has started to curl upward again and seems to be picking up steam. If this rotation can continue clockwise and move back into the leading quadrant, precious metals are all set for a new relative uptrend.
Gold And Silver
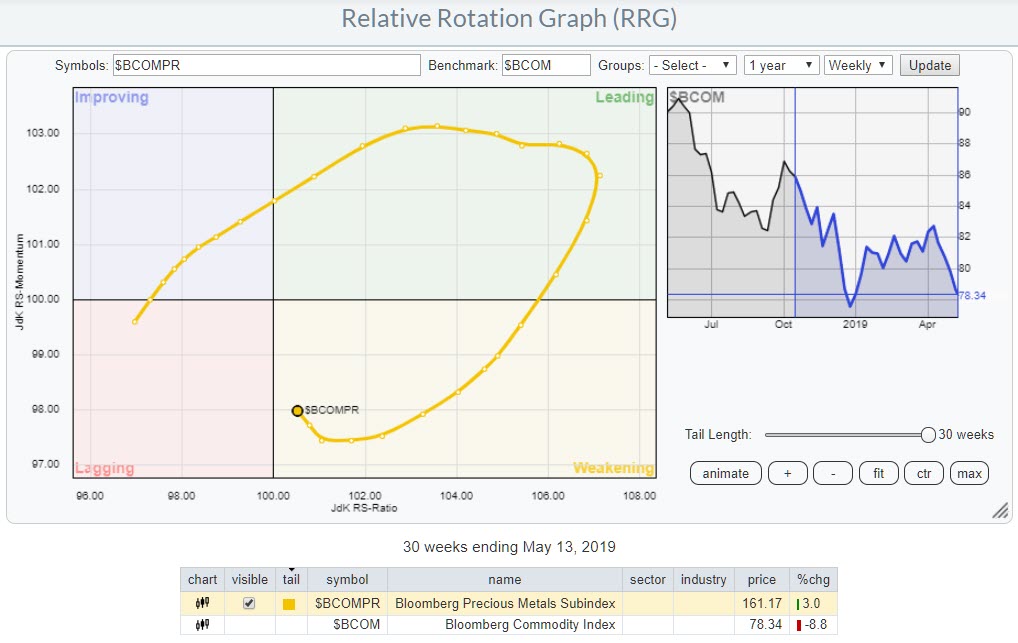
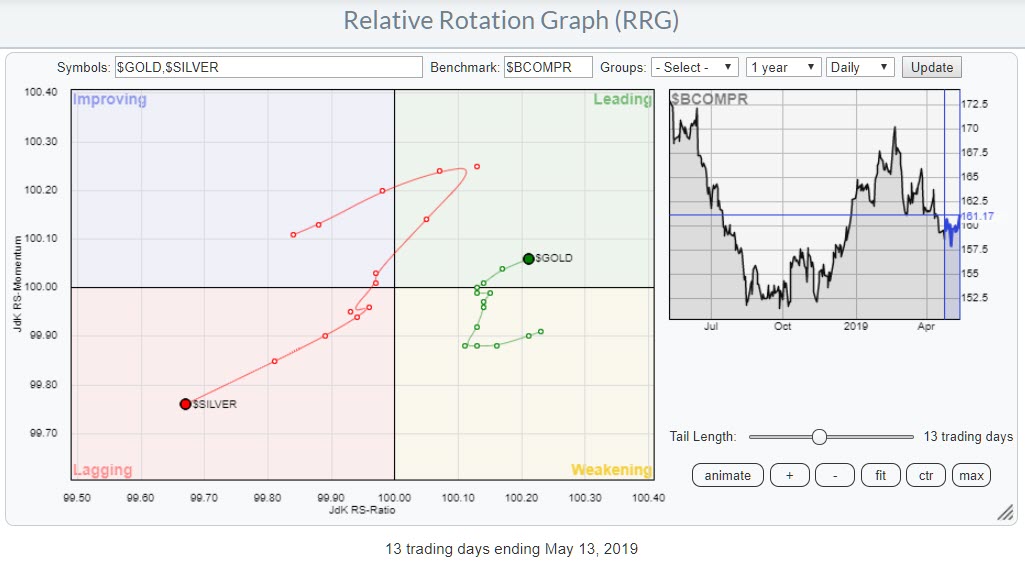 As the Precious Metals group only consists of Gold (75%) and Silver (25%), it makes sense to look at a Relative Rotation Graph of these two commodities against the Precious Metals index ($BCOMPR), as the chart above does.
Said chart is a daily chart that highlights the most recent rotation and shows Gold's rapid rotation back to the leading quadrant. Meanwhile, Silver is now nose-diving further into the lagging quadrant. The chart clearly shows that we should have a preference for Gold over Silver for now.
If you open the live version of this RRG, you will see that the tail for Silver is generally longer than the tail for Gold, as well as that that Silver makes wider rotations. This is because of the heavy weight of Gold (75%) in that group, which drags it closer to the benchmark (center of the RRG) by default.
Gold
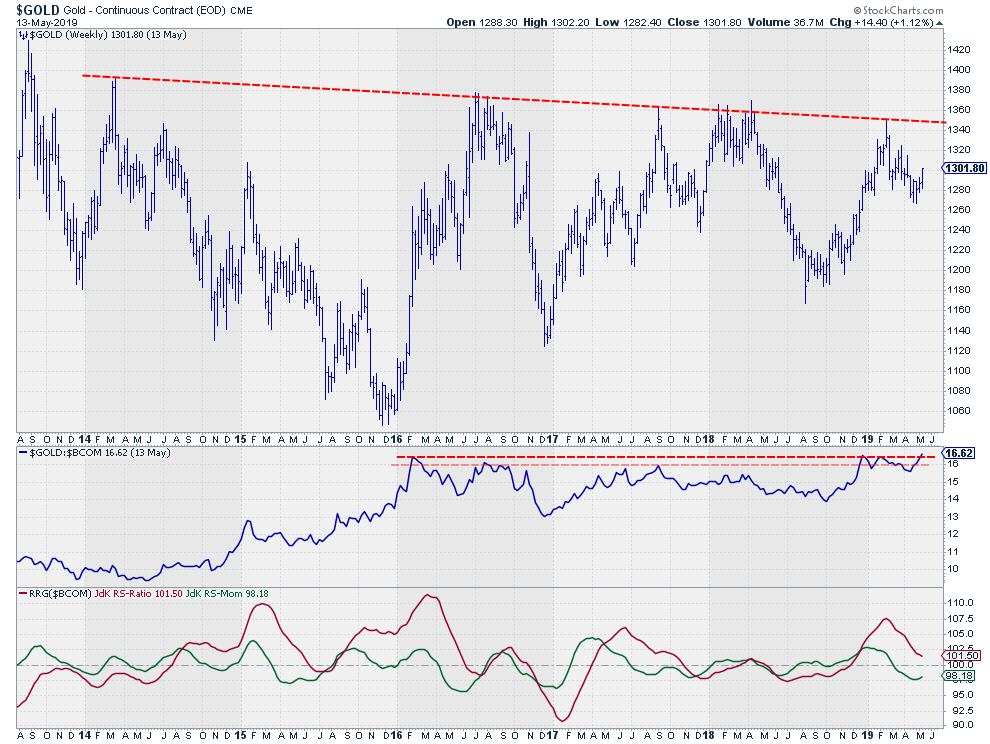 The improvement on the RRG follows the recent improvement of the RS-line of Gold vs. $BCOM, which is now close to breaking above that horizontal resistance level. When such a break materializes, a further relative rally is likely; this will pull the tail for $GOLD back into the leading quadrant without hitting lagging.
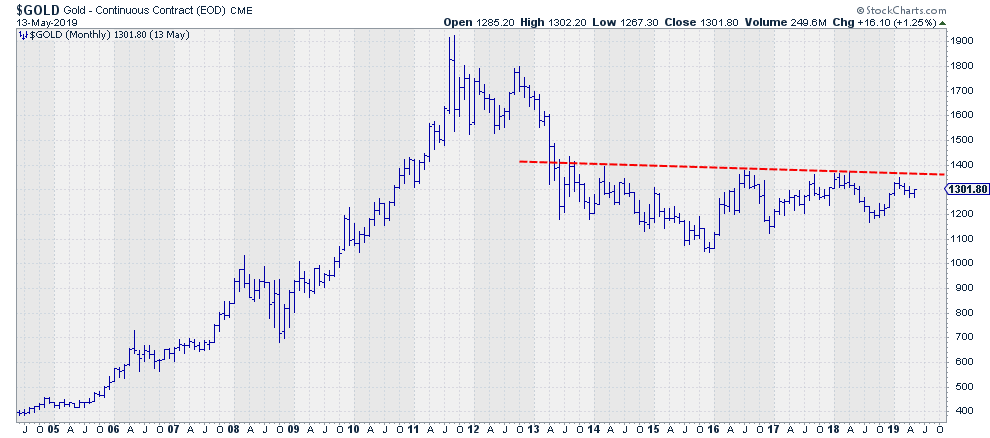
On the price chart, $GOLD still needs to conquer a very heavy overhead resistance level, marked by the slightly falling trend line connecting the major highs since 2014. This seems to be a significant level. It already "looks" heavy on the weekly chart above, but, when you zoom out to the monthly chart, that level becomes even more significant.
A break beyond $1400 in Gold will be very significant! As Martin Pring says, it's "a mega resistance."
From a Stock Market or Asset Allocation Perspective
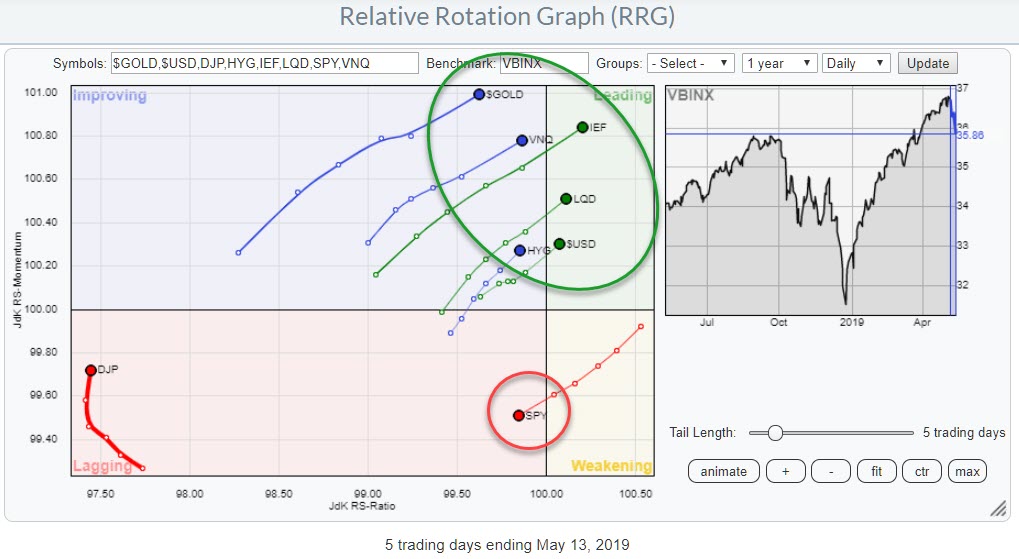 As Gold often serves as a safe haven, we should put things into perspective and use a Relative Rotation Graph that shows Asset Class rotation. The chart above is the pre-defined RRG for Asset Classes with $GOLD added to the universe.
Gold is now the Asset Class with the highest reading on the Jdk RS-Momentum scale and is rapidly rotating towards the leading quadrant on the daily timeframe. This visualizes the move out of stocks (SPY) into bond-related asset classes and Gold.
For the time being, this looks to be the way to go and is the preferred positioning for portfolios.
Recently On Twitter
Out of pure curiosity I added GLD to Your collection. Very interesting to see how it fares...Thanks again for a great analysis @RRGresearch @StockCharts pic.twitter.com/kVxlmOecCm
— Daniel L. Mersebak (@Mersebak) May 11, 2019
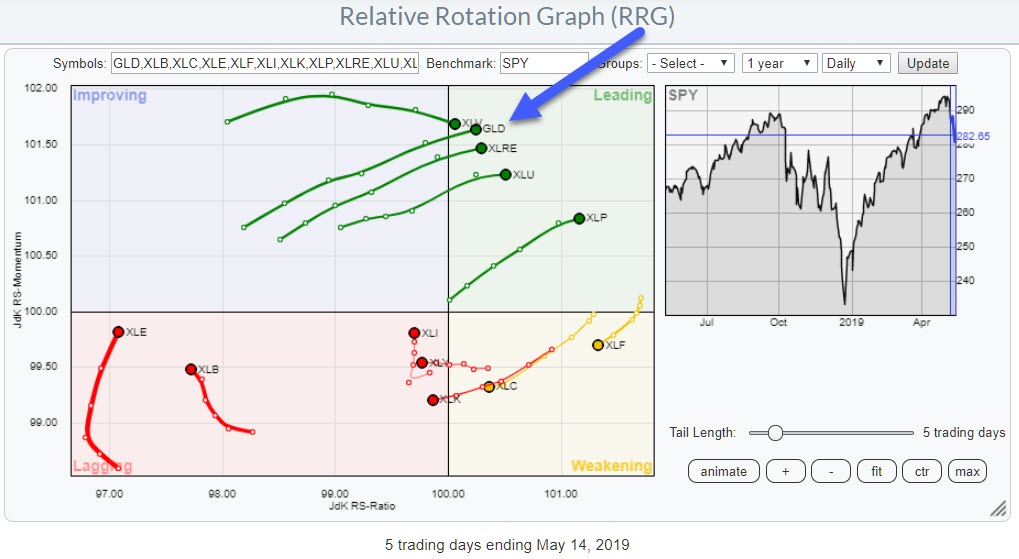
This user added GLD to the predefined universe for US sectors. GLD's position is now closely aligned with those of the more defensive sectors, and it is currently pushing into the leading quadrant right alongside them.
Here's the chart with a link to the live version.
Let me know what you think of this usage of RRG in the comments below. If you would like to receive a notification when a new RRG Charts blog article is published, simply subscribe with your email address using the form below.
Julius de Kempenaer
Senior Technical Analyst, StockCharts.com
Creator, Relative Rotation Graphs
Founder, RRG Research
Want to stay up to date with the latest market insights from Julius?
– Follow @RRGResearch on Twitter
– Like RRG Research on Facebook
– Follow RRG Research on LinkedIn
– Subscribe to the RRG Charts blog on StockCharts