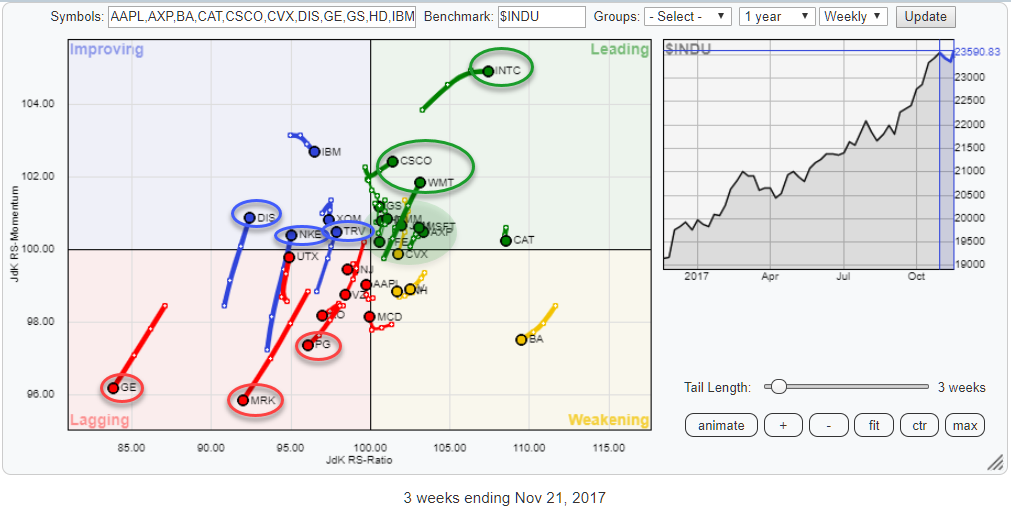
 Above is the Relative Rotation Graph for the DJ Industrials index, comparing the relative rotation of all members around $INDU.
On this chart, a few stocks stand out because of their clear directional moves.
Inside the leading quadrant, INTC, CSCO, and WMT are pulling away from the crowd further into positive territory. Inside the lagging quadrant, on the other hand, PG, MRK, and especially GE are heading in the opposite direction.
Summary
- GE in steep drop in both price and relative charts
- Relative downtrend for MRK accelerating after downward break out of channel
- PG ready to start new decline in price and move lower in relative terms
- CSCO coming out of relative downtrend against DJ-Industrials
- WMT shooting for the stars on price chart but still plenty of upside potential available from a relative perspective
Weak names inside the lagging quadrant
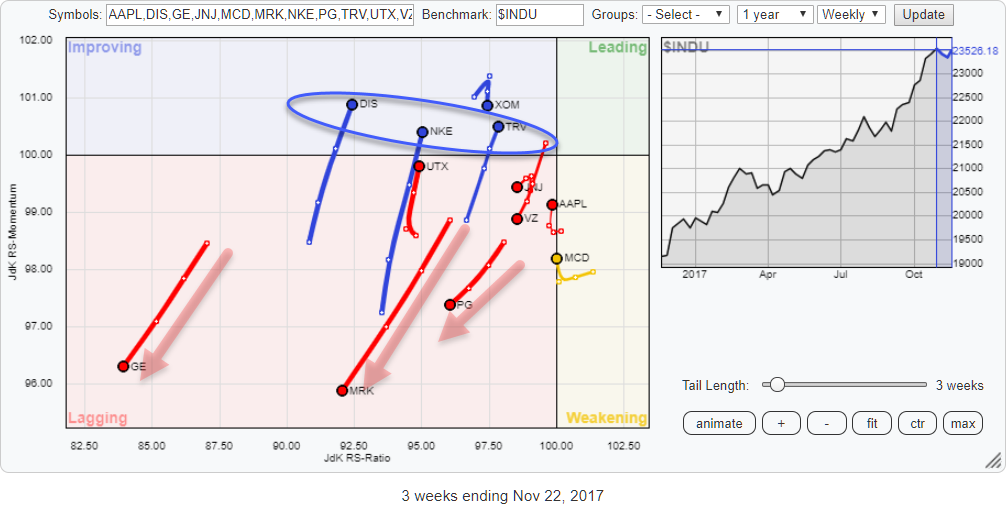
Inside the lagging quadrant, there are a few names that really stand out negatively. These are PG, MRK, and GE.
Especially MRK and GE are backed by a long tail pointing in South-West direction, but they are closely followed by PG which does not have such a long tail yet but seems to be picking up steam.
General Electric - GE
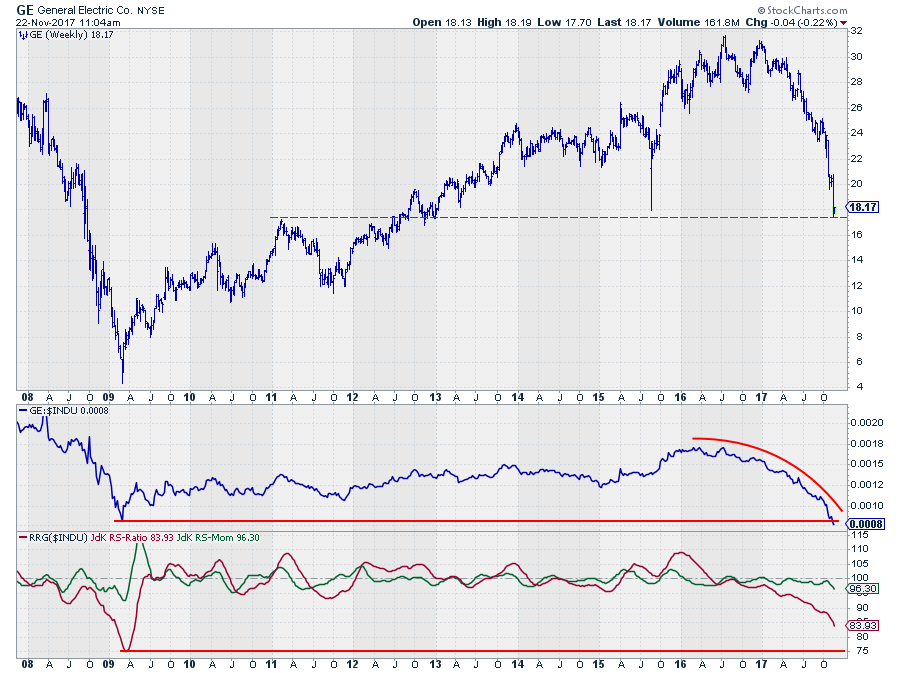
GE is in an absolute freefall since the start of this year. With a strong stock market, in general, this results in a steep decline in relative strength as well.
This week the price of GE seems to be hitting a support level, albeit an old and fragile level. This could provide some relief for the almost vertical drop and cause a bit of a bounce. Do I think it is a buy here? NO WAY. This looks more like a falling knife to me, and you know what to (not) do with those...
On the relative charts, things look even worse as the RS-Line is about to drop below its lowest point that was recorded early 2009. This frees the way for even more relative downside.
The RRG-Lines and more specifically the JdK RS-Ratio line still has plenty of room to move lower before it reaches the 2009 low. The way to interpret this is that the relative "trend" (This is what JdK RS-Ratio is measuring) has more room to move in the same direction before it will the extreme levels that were seen in 2009.
With such low readings on the JdK RS-Ratio scale being pushed further down with dropping JdK RS-Momentum values and the raw RS-line moving to new lows, any recovery here should be regarded as a recovery within an existing downtrend.
From a rotational point of view, such a recovery will very likely lead to a complete rotation at the left side of the RRG. I.e. Lagging -> Improving -> Lagging.
Merck & Co. - MRK
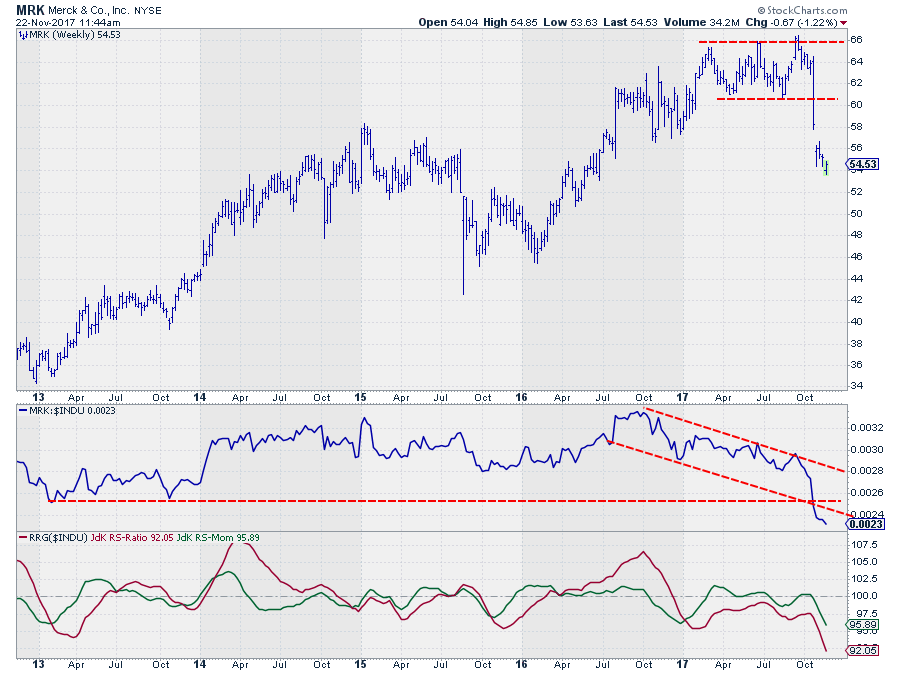
The steep drop for MRK only started in October, but the stock had been trading sideways since the beginning of the year. Clearly not able to keep up with the general trend of the market, resulting in a relative strength line that moved inside a falling channel until a few weeks ago.
The long weekly bar that pushed MRK out of its trading range on the price chart caused the decline in the RS-Line to accelerate and eventually pushed it out of the falling channel on the downside. Often a break out of an already falling channel leads to an acceleration in the decline. At the minimum, upside potential will be limited to the breakout level for the time being.
The downward break in relative strength, confirms the downtrend that is signaled by the RRG-Lines which are both below 100 and moving lower. The RS-Ratio line already moved below 100 back in December 2016. The RS-Momentum line moving back above 100 a few times in 2017 so far, caused the rotations for MRK on the Relative Rotation Graph to take place on the left-hand side of the chart, underscoring the weakness of the current relative trend.
With RS-Ratio seeking new lows and rotation caused by an uptick in price/relative is expected to trace out on the left hand, negative, side of the RRG. So remain very cautious!
Procter & Gamble - PG
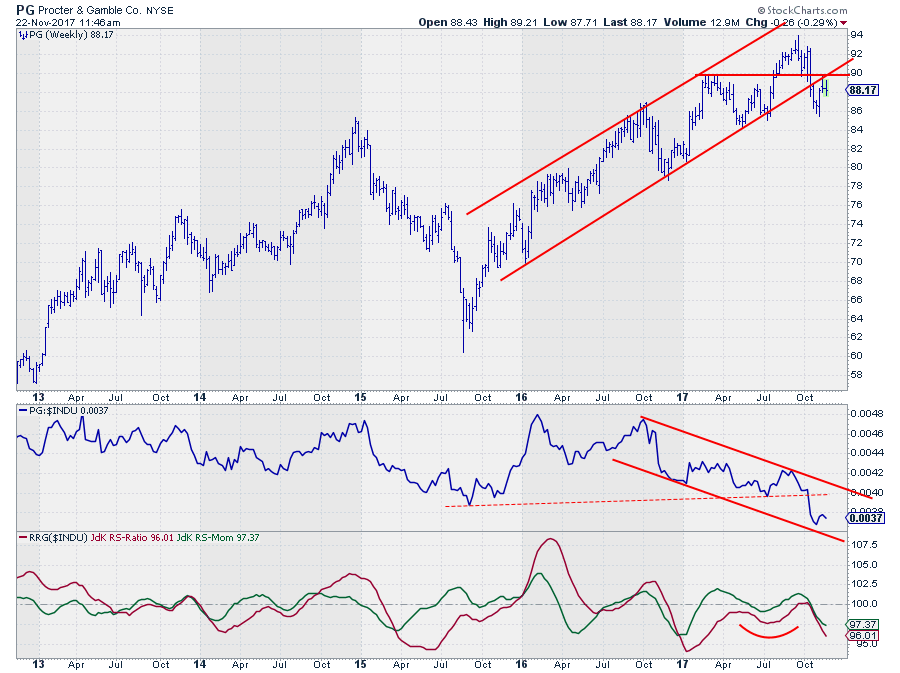
PG is highest on the RS-Ratio scale but heading firmly deeper into the lagging quadrant after a rotation which, very, briefly touched the leading quadrant, then back into improving for one week and then straight into lagging at a weak RRG-Heading (180-270 degrees).
I am interpreting this as a very weak rotational pattern and expect PG to move further and deeper into the lagging quadrant in coming weeks.
The break below support in the RS-Line supports this view. The RS-Line is still within the boundaries of the falling channel and close to the lower boundary. This could lead to some recovery, but the former support level (red dashed line) is expected to act as resistance.
The resulting RRG-Lines are already sending the message for further downward relative movement, and there is still some room for the trend to continue before it hits the lows that were reached in 2015 and early 2017.
Finally, also the price chart, supports the case of weakening in the weeks ahead. Price broke out of its rising channel a few weeks ago, and after setting a low after the initial decline, PG is now forming a new, lower, peak against the double resistance level near $ 90 coming off the former rising support line and the horizontal resistance level coming off the early 2017 peak.
Cherry picking in the leading quadrant
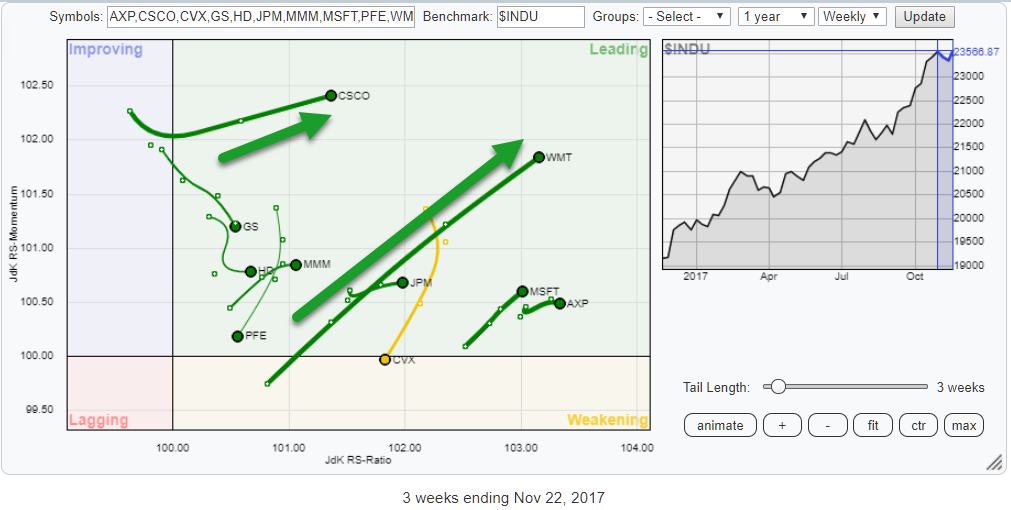
Besides the three stocks mentioned (INTC, CSCO, and WMT) there is a cluster of stocks positioned in the lower left corner of the leading quadrant, close to the benchmark. The RRG above zooms in on that area, to be able to spot the rotational pattern of these names better.
The chart confirms the long and strong tails for CSCO and WMT, but it also shows stable rotations for MSFT and AXP.
JPM and MMM are still heading higher on the JdK RS-Ratio scale but could use a bit more relative momentum to back their moves.
PFE and CVX are losing on the JdK RS-Momentum scale which makes them vulnerable.
Cisco Systems Inc. - CSCO
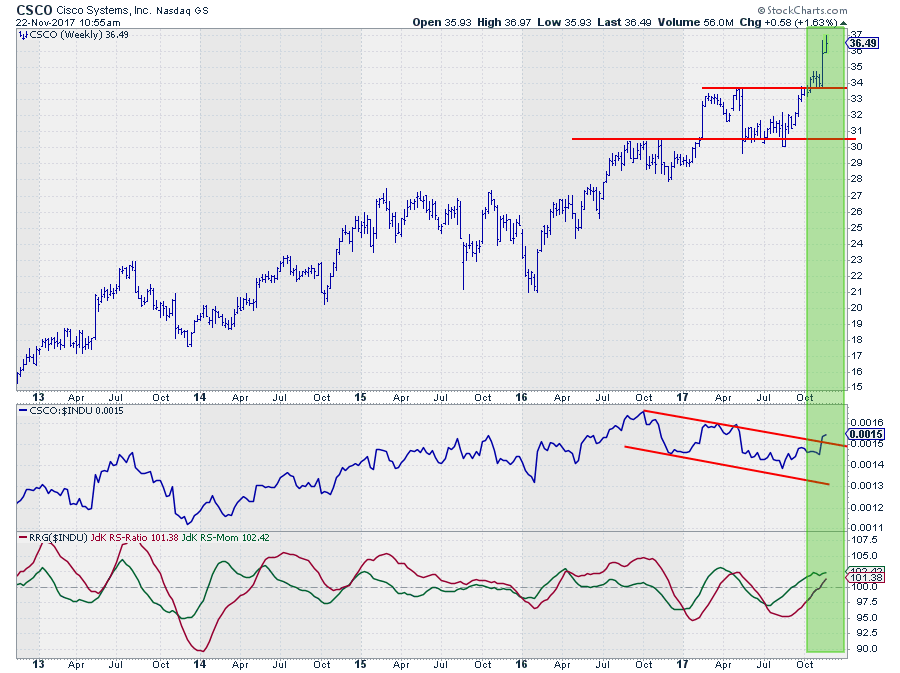
Cisco jumped upward out of a sideways move at the beginning of October, tested the former resistance level as support and now started to push higher. This means that downside is now well-protected which makes dips new buying opportunities.
The real opportunity IMHO lies in the relative picture. The raw RS-Line (vs. DJ-Industrials) just broke out of a falling channel that lasted for more than a year, and this has pulled both RRG-Lines above 100 indicating that a relative uptrend is underway.
Looking at the level of the RS-Ratio line there is plenty of room to move higher before "high" or "extreme" levels are reached. 105 on the RS-Ratio scale seems to be a level where the trend usually starts to roll over.
With CSCO being the stock with the third highest reading on the RS-Momentum scale and a positive RRG-Heading it seems to offer a good opportunity for outperformance going forward.
Wal-Mart Stores, Inc. - WMT
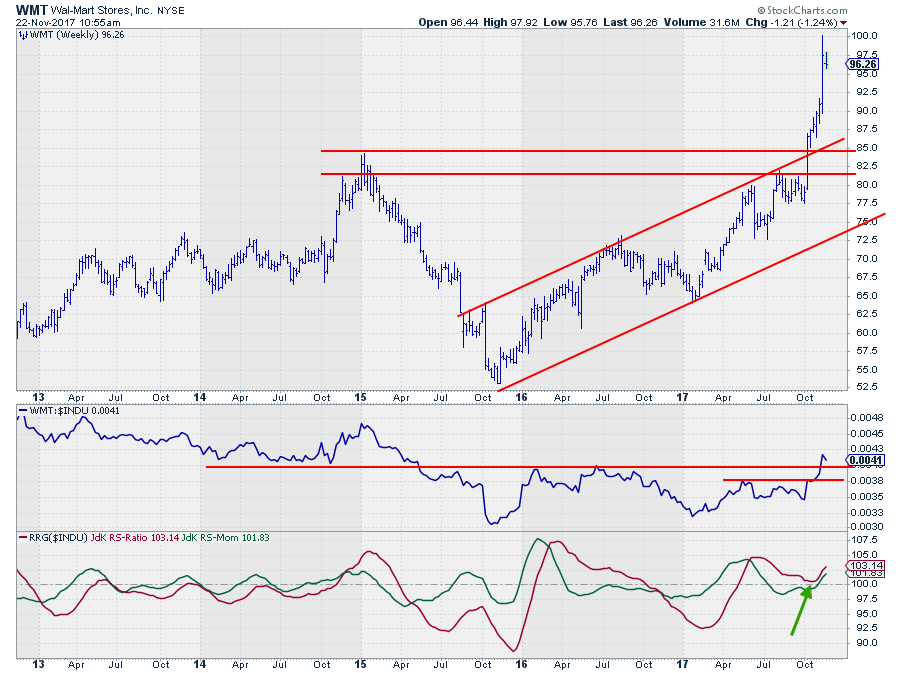
The RS-Ratio line crossed above the 100-level in May when the relative strength line started to work its way out of a low that was set around the same levels as the prior relative low in 2015. The subsequent sideways move caused relative momentum to ease off a bit, but the weakness never got strong enough to push the trend back down.
With RS-Ratio bottoming out above 100 and RS-Momentum pushing back above 100 again at the same pace WMT is now at a strong RRG-Heading of almost 45 degrees. This, in combination with the position on the RRG, makes it one of the strongest and most promising stocks inside the DJ-Industrials index at the moment.
If you like to receive a notification anytime, a new article is posted in this RRG blog, please leave your email address and press the green "Notify Me!" button below this article.
Julius de Kempenaer | RRG Research
RRG, Relative Rotation Graphs, JdK RS-Ratio, and JdK RS-Momentum are registered TradeMarks by RRG Research
Follow RRG Research on social media:
If you want to discuss RRG with me on SCAN, please use my handle Julius_RRG so that I will get a notification