Welcome to the recap of Monday's MarketWatchers LIVE show, your antidote for the CNBC/FBN lunchtime talking heads. Listen and watch a show devoted to technical analysis of the stock market with live market updates and symbols that are hot.
Information abounds in our Monday/Wednesday/Friday 12:00pm - 1:30pm EST shows, but the MWL blog will give you a quick recap. Be sure and check out the MarketWatchers LIVE ChartList for many of today's charts. When you first arrive at the MarketWatchers LIVE blog page, you'll see a link to the ChartList in the upper left corner.
Your comments, questions and suggestions are welcome. Our Twitter handle is @MktWatchersLive and/or #mktwatchers, email is marketwatchers@stockcharts.com and our Facebook page is up and running so "like" it at MarketWatchers LIVE. Don't forget to sign up for notifications at the bottom of this blog article by filling in your email address and hitting the green "Notify Me!" button.
What Happened Today?
Well, it's another big week for earnings as nearly 1200 companies will report their quarterly results over a three day stretch beginning on Tuesday. The highlight will be Apple (AAPL), which will report its results after the market closes on Tuesday.
Today, June pending home sales were released at 10am EST and Tom noted that, despite a solid and better than expected report, home construction stocks ($DJUSHB) were under pressure and the group was testing a very solid trendline from the past three months:
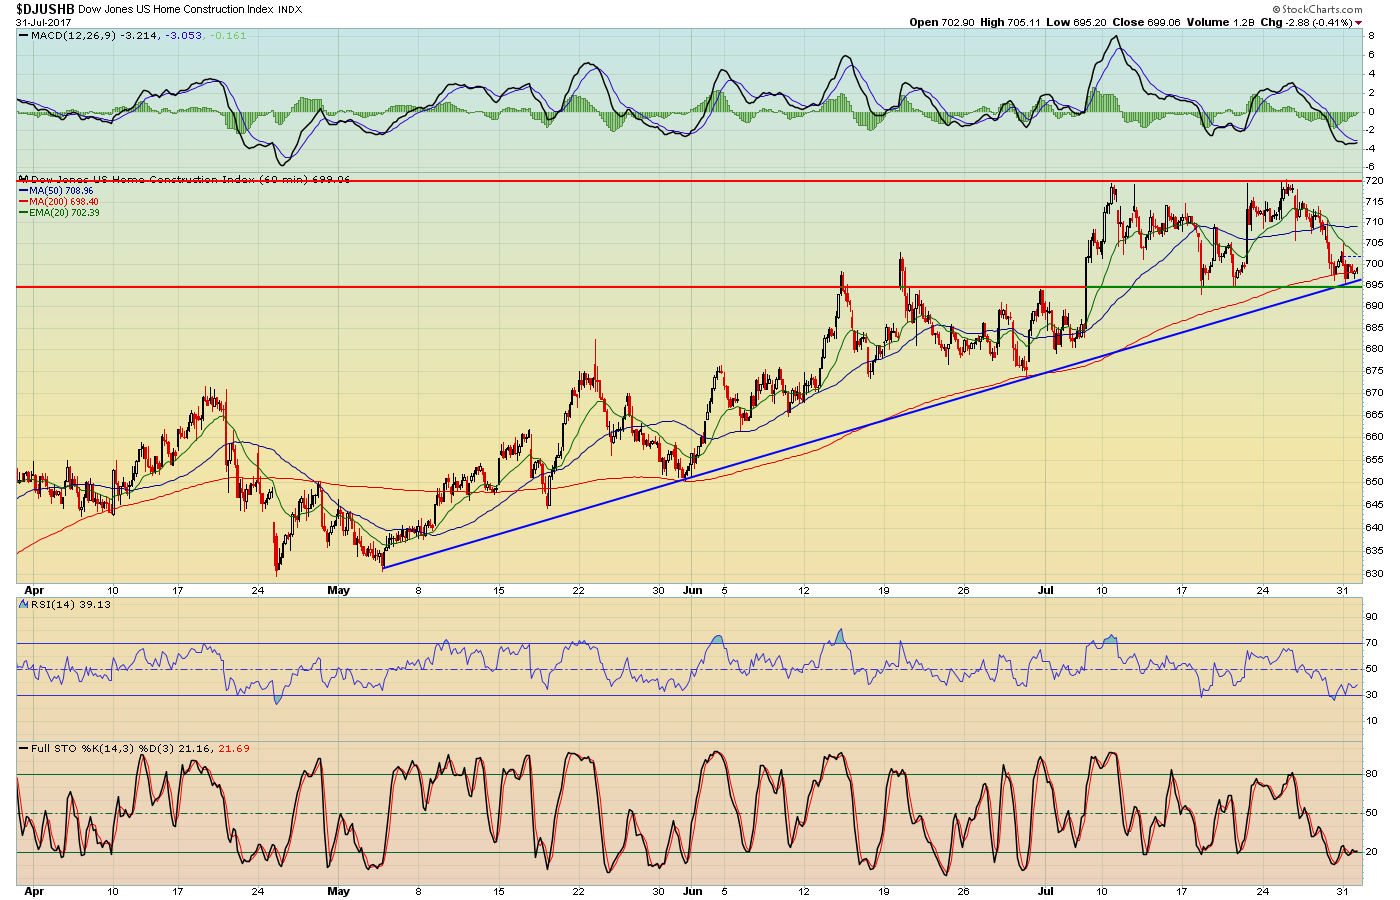 In addition to trendline support, the DJUSHB also was testing price support near the 695 level. The leading index of 2017 - the NASDAQ 100 ($NDX) - was having technical issues of its own, losing trendline support recently and now trying to reclaim its 20 hour EMA. Check it out:
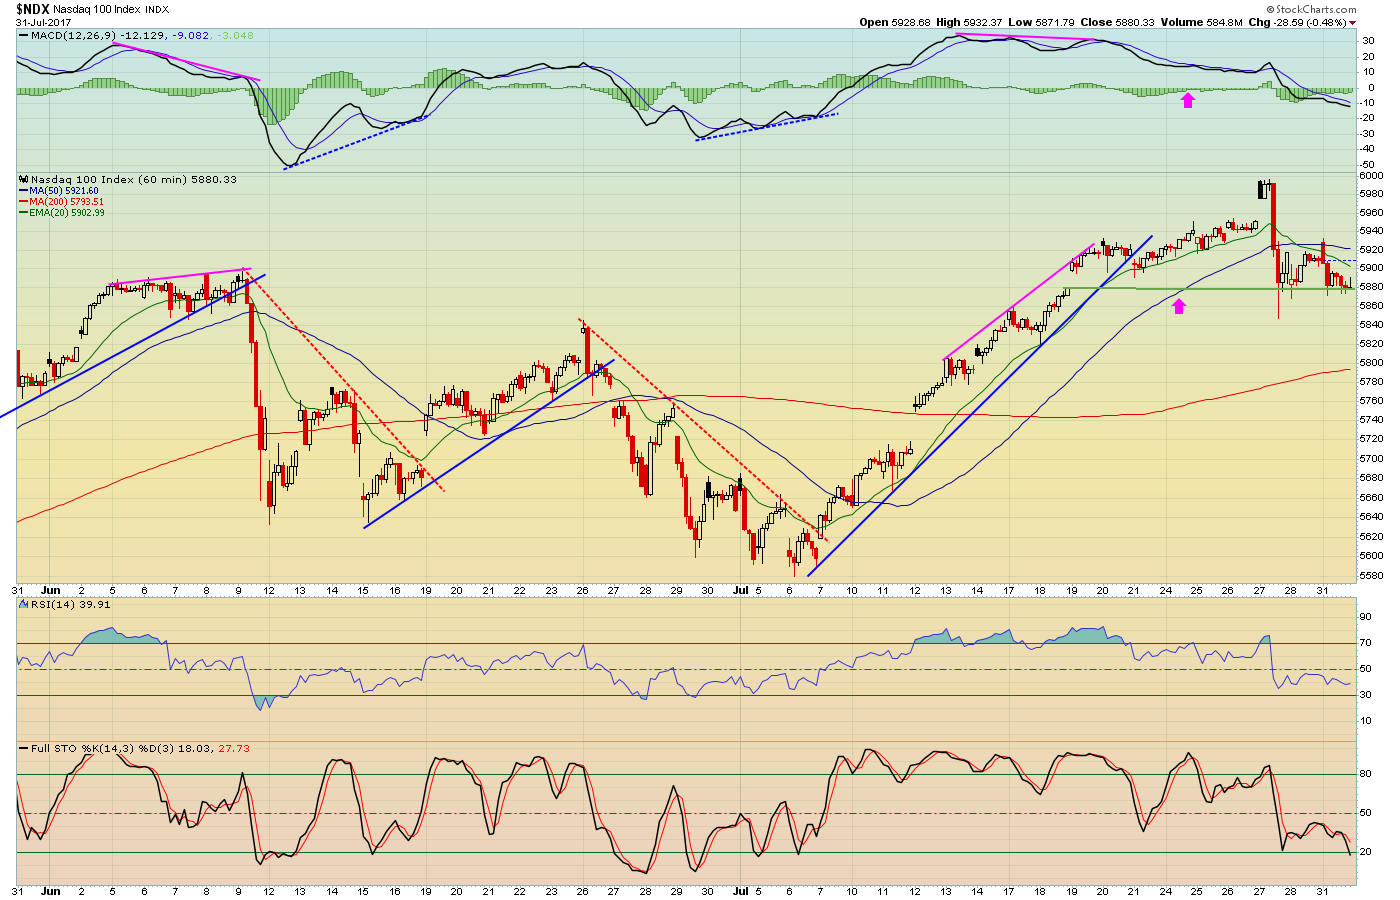 Gap support at 5880 is now the key short-term support level for this technology-laden index. A break below this level on Tuesday could lead to more selling ahead of Apple's big report tomorrow afternoon.
Monday Setups
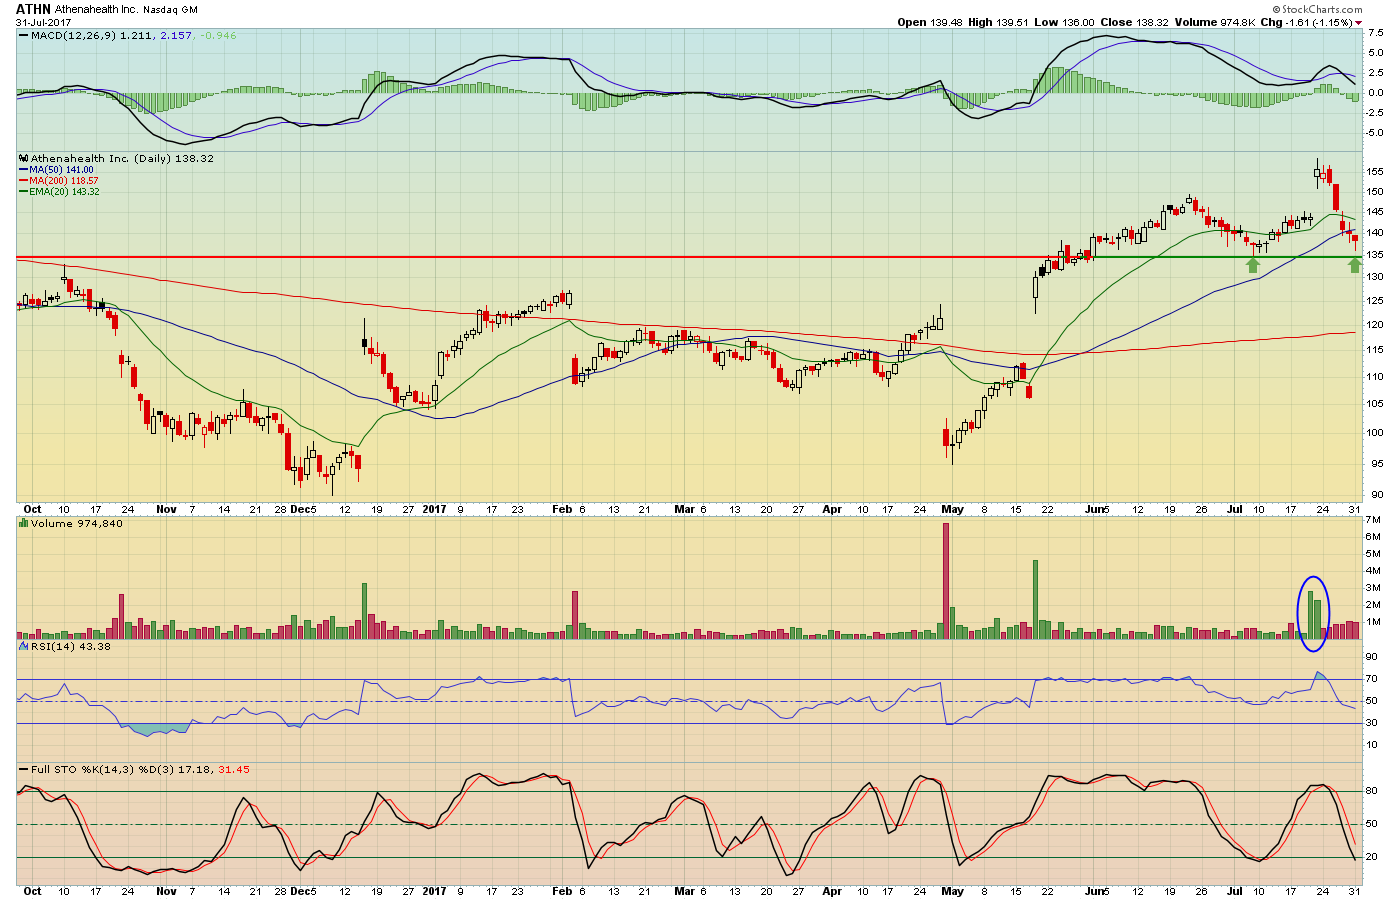
Tom and Greg both shared their picks of the week today. For Tom, he sided with Athenahealth (ATHN), which has sold off more than 10% since gapping higher on revenues and EPS that exceeded Wall Street consensus estimates on July 20th. Here's the chart:
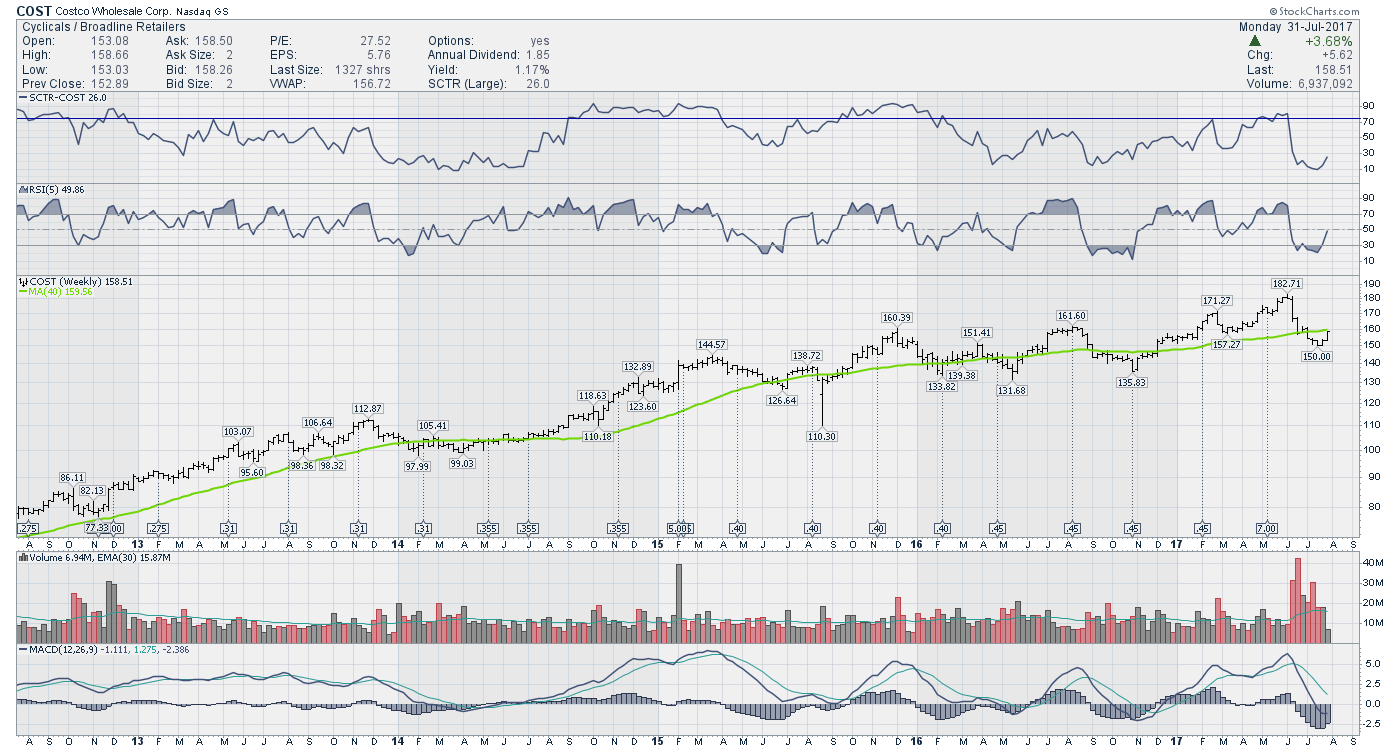
 Meanwhile, Greg argued that Costco's (COST) weakness from the Amazon.com (AMZN) - Whole Foods (WFM) combination was overdone and was providing a great short-term opportunity. He further explained that using the RSI 5 as it moves out of oversold territory can be a great signal for profitable trading. COST saw very heavy volume on Monday as it closed back above its 20 day EMA for the first time in six weeks:
 Earnings Spotlight
John Hopkins, President of EarningsBeats.com joined the show and discussed the earnings disappointments that we've seen from a couple of the big names. Both Amazon.com (AMZN) and Alphabet (GOOGL) were treated rudely after they reported their quarterly results and now we have Apple (AAPL) on deck. John pointed out that EarningsBeats.com's Chart of the Week was General Electric (GE), intrigued by the recent lows following top and bottom line beats.
10 in 10
During his regular segment at 12:50pm EST, Tom showed how quickly you can review and annotate 10 stocks into a ChartList using the powerful tools here at StockCharts.com. Symbol requests were sent in by viewers on Twitter and GoToWebinar as Tom demonstrated how to use the annotation tool to highlight key levels of price support/resistance, trendline support, candlestick patterns, etc. Symbols reviewed today included AVY, BBBY, BLUE, IFF, JAZZ, MFC, PFE, PII, QTWO and YRD. You'll find all of the charts in the MarketWatchers LIVE ChartList, located at the top of the MarketWatchers LIVE blog page.
Mailbag
An astute viewer asked Greg about his choice for Costco (COST), pointing out that Greg generally discusses stocks with SCTR scores at 75 or higher. COST's SCTR score was only 22 so the question was "why buy a stock with a SCTR score so low?"
Greg pointed out that there are momentum trades and value trades. He indicated that he likes stocks with overall uptrends in place that pull back temporarily to print lower SCTR scores. Therefore, he will occasionally buy strong stocks that fall out of favor temporarily, which is exactly the category that COST fit into. He said that stocks with SCTR scores in the middle 25-75 range can languish so he typically avoids stocks with those ranks.
Looking Ahead
Wednesday will be interesting for sure. Tom and Greg will both dissect Apple's (AAPL) chart following the market's reaction to its earnings report. That will make for some interesting dialogue. And AAPL's reaction will no doubt play a major role in the NDX's ability to reverse out of its recent downtrend.
Happy trading!
