In a truncated 3-day working week, the Indian equity markets headed nowhere and ended the week on a flat note once again. In our previous weekly note, we had mentioned the possibility of the NIFTY failing to break resistance at 11760. In the week that went by, though the markets remained generally volatile, the NIFTY did not make any fresh incremental high. The week ended on relatively flat note as the headline index settled with a net loss of 42.40 points (-0.36%) on a weekly basis.
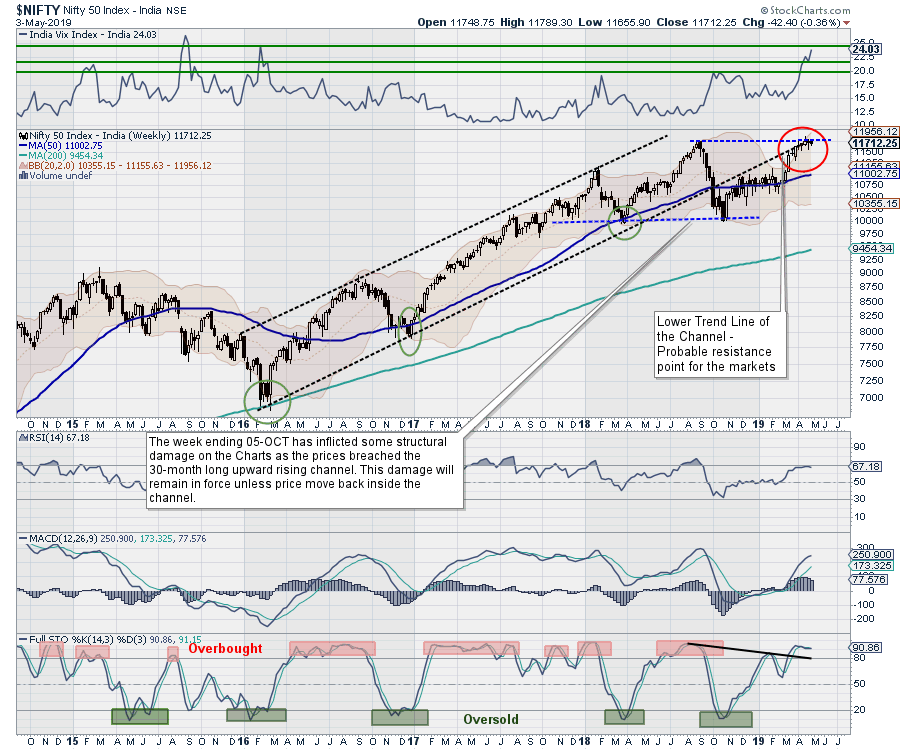
The NIFTY has yet to break above the 11760 mark, which is acting as a major double top resistance for the markets. Beyond that, the India VIX has further risen by 10.66% to 24.03 this week and remains at a multi-year high, defying its usual inverse relationship with NIFTY. With caution building up ahead of general election results, we do not expect the index to make any major surge; the level of 11760 will remain an all-important level to watch.
The coming week will see the levels of 11760 and 11860 acting as important and stiff resistance points for the market. The supports come in much lower, at 11550 and 11480.
The weekly RSI is 67.1770 and remains neutral against the 14-week lookback period. However, just like daily charts, the weekly charts depict the RSI showing a bearish divergence against the price on the longer period. The weekly MACD is bullish and is trading above its signal line. A spinning top candle emerged. Spinning tops are candles whose upper and lower shadows exceed the length of their bodies. The emergence of such a pattern near the high point can often shows indecisiveness of the market participants and a potential loss of steam.
The pattern analysis of the weekly charts shows that the level of 11760 remains intact as a major double top resistance for the markets. Though the NIFTY did mark an incremental high at 11856, the breakout eventually failed as the index returned below the important resistance mark of 11760.
As we step into the coming week, we need to continue approaching the markets with great caution. There are very few sectors that are positively rotating and leading as compared to the broader markets. The major sectors are seen taking a breather, which will be reflected in the market breadth becoming weaker over the coming days. We recommend remaining position-light in the markets and avoid aggressively using dips to make purchases. A highly cautious view is advised for the week.
Sector Analysis for the Coming Week
In our look at Relative Rotation Graphs, we compared various sectors against CNX500, which represents over 95% of the free float market cap of all the stocks listed.
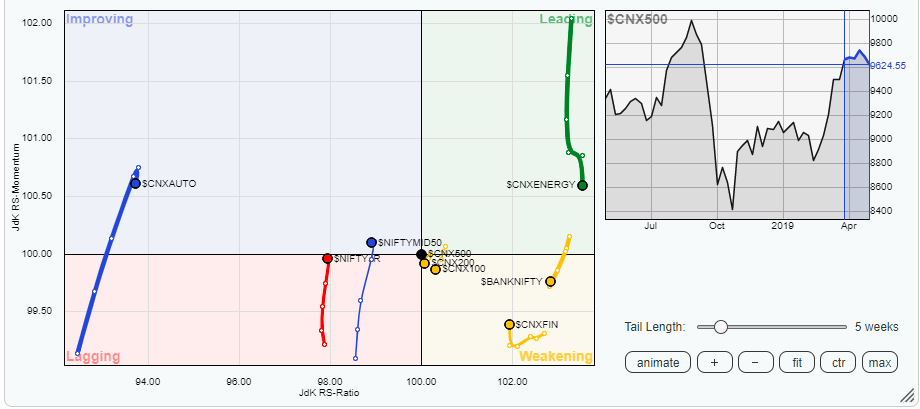
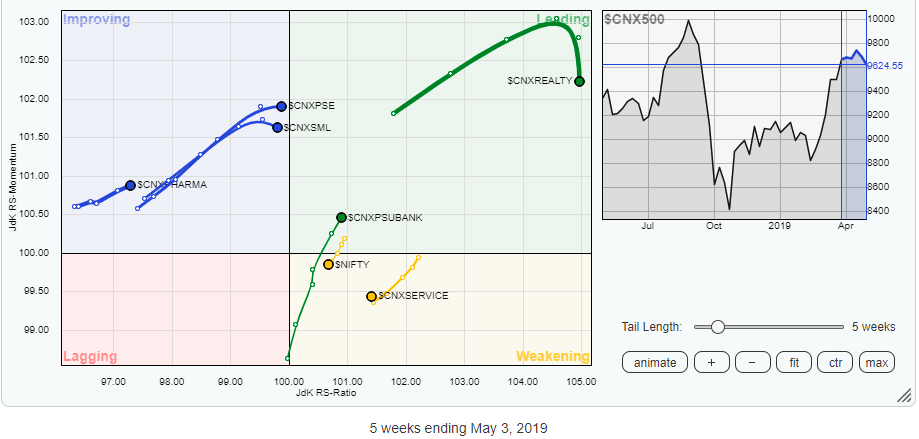
The review of Relative Rotation Graphs (RRG) paints a not-so-pleasant picture. There are only three sectors in the leading quadrant; out of those three, the Realty and Energy packs are sharply losing momentum and, unless they reverse their move, are unlikely to contribute much to the coming week, though they may remain broadly resilient.
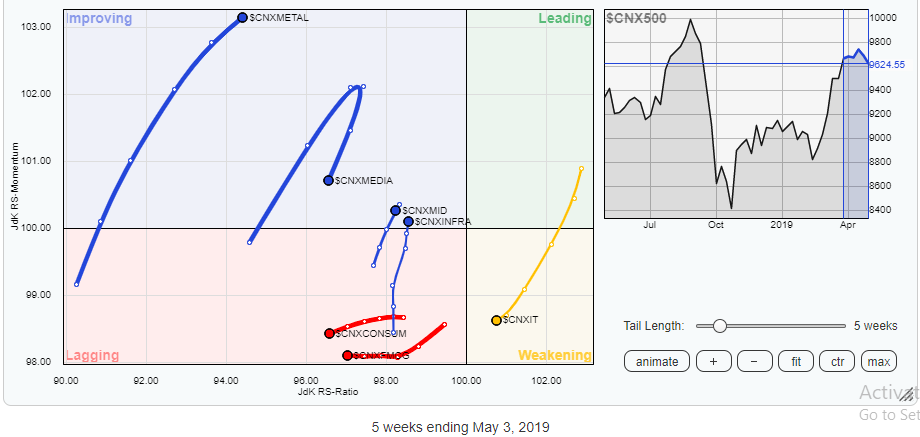
The Services, IT, Financial Services, BankNifty, Consumption and FMCG groups are seen moving downward; a continued loss of momentum is seen when compared to the broader CNX500 index. Similar loss of momentum is also observed in the media pack.
The PSU Bank index has moved further into the leading quadrant while keeping its momentum intact. This group is likely to relatively outperform the broader markets. Additionally, the Metal pack, along with the Infra, Pharma and PSE groups, remain in the improving quadrant and are likely to post some stock-specific out-performance.
Important Note: RRG™ charts show you the relative strength and momentum for a group of stocks. In the above chart, they show relative performance as against NIFTY500 Index (Broader Markets) and should not be used directly as buy or sell signals.
Milan Vaishnav, CMT, MSTA
Consulting Technical Analyst
www.EquityResearch.asia