Kohinoor Foods and Godrej Agrovet have under-performed the broader markets for quite some time. Presently, both of them are set to end their downward trajectory and look for some upward revision in prices over the coming days.
Kohinoor Foods Ltd (KOHINOOR.IN)
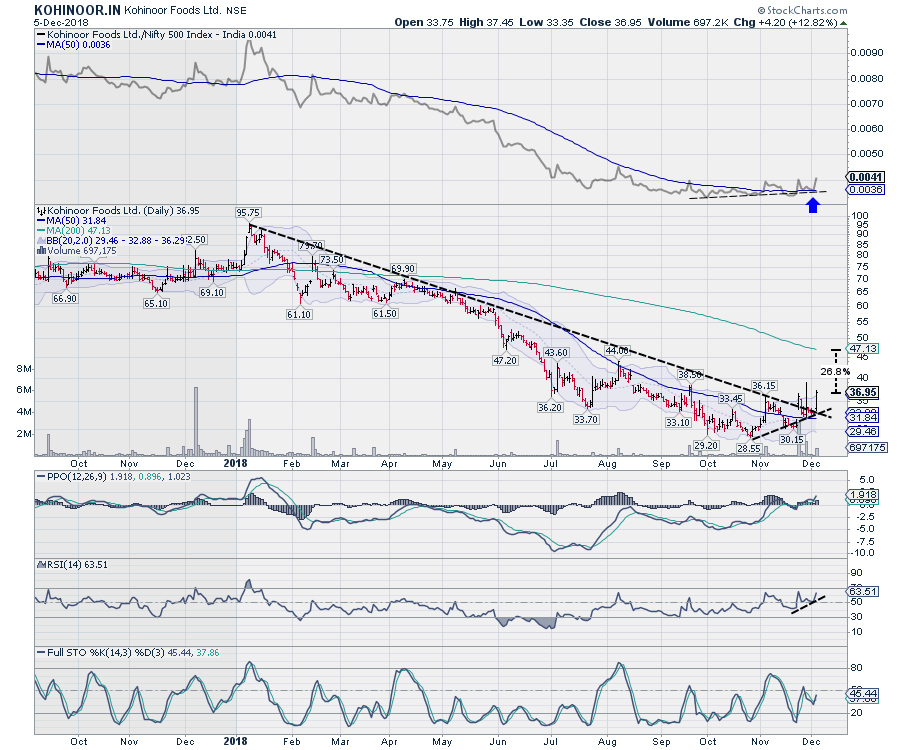
After hitting a high of 95.75 in early 2018, the stock has remained in a prolonged corrective action. The prices have traded in a falling channel that began in early 2018; the stock went on to mark a low of 28.55 in the month of November. During the past couple of weeks, the stock has shown some signs of ending this downtrend and forming a base for itself. After oscillating in a range of 28.55 and 31 for few weeks, the prices have attempted to reverse the current trend.
The price of KOHINOOR.IN ended outside its upper Bollinger band. This, when combined with the steep up-move that the stock witnessed, suggests that the upward trend in prices has a good chance of continuing. The Relative Strength Index (RSI) is seen marking higher bottoms and moving higher. Daily MACD remains in buy mode and PPO remains positive.
The RS Line, when compared against the broader markets, has ended its downward trajectory and flattened itself. RS Line has crossed its 50-DMA, which confirms the beginning of relative out-performance of KOHINOOR.IN against the broader markets. The increase in volumes in the 28.55-31 zones also mark the possibility of a formation of a potential bottom in that range. On the weekly charts, the stock is seen taking support at its major pattern support and bounce back from there.
There is a minor chance that the stock price could temporarily pull back inside the band. It is more likely, however, that the uptrend in price will continue. If this happens, we may see the stock price testing its 200-DMA, which is presently at 47.13. This translates into potential returns of ~26% from current levels of 36.95. Any move below 29 will be negative for the stock.
Godrej Agrovet Ltd (GODREJAGRO.IN)
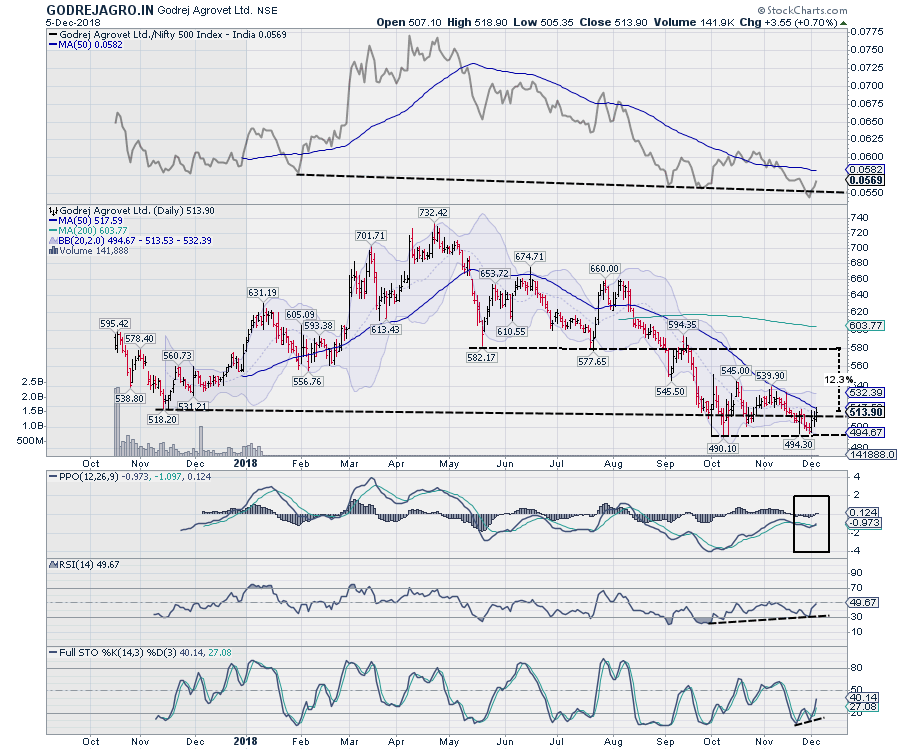
This stock has a relatively short listing history. GODREJAGRO.IN listed in October 2017; in a retracement that followed, the stock saw the low of 518. Afterwards, the stock experienced an uptrend, marking a high of 732 in April 2018. Since then, the stock has remained in a corrective action, trading in a falling trajectory and forming lower tops. The stock marked a fresh low at 490 in early October 2018.
The past couple of weeks have seen the stock attempting to form a potential bottom. The prices have oscillated in the range of 490-532. Few signals have emerged, which point towards a likely reversal of trend.
A double bottom support level has formed in the 490-494 range. The RS Line, too, is seen resting at its pattern support, but is attempting to move higher.
The stock is resisting at its 50-DMA, which is presently at 517. RSI has marked a fresh 14-period high which is bullish. Additionally, RSI shows a bullish divergence against the price. MACD has shown a positive crossover; it is now bullish and trades above its signal line. PPO has just turned positive.
The Bollinger bands are over 50% narrower than normal. The narrow width of the bands suggests low volatility compared to GODREJAGRO.IN's normal range. The probability of significant price move increases the longer the bands remain in this narrow range.
A fresh up move is expected to resume once the price crosses the 50-DMA. If this happens, the stock has the potential to return ~12% from the current levels of 513.90. Any move below 490 will be negative for the stock.
Milan Vaishnav, CMT, MSTA
Consulting Technical Analyst
www.EquityResearch.asia
Disclosure pursuant to Clause 19 of SEBI (Research Analysts) Regulations 2014: Analyst, Family Members or his Associates holds no financial interest below 1% or higher than 1% and has not received any compensation from the Companies discussed.