 One of the Relative Rotation Graphs that I like to follow, as a way of keeping a handle on the bigger picture, is the one that shows the rotation of growth- versus value stocks.
This RRG is predefined in the dropdown box under the header "US MARKETS" and shows the rotation of the Dow Jones US Growth index against the Dow Jones US Value index. The benchmark is set as the Dow Jones US Index ($DJUS).
If you click on the image above and then on "Live Chart" in the subsequent link, you can monitor the actual rotation on a day-to-day basis, though I prefer to use the weekly version as these shifts from Value to Growth and back do not happen overnight.
Growth Rolling Over After Period Of Outperformance
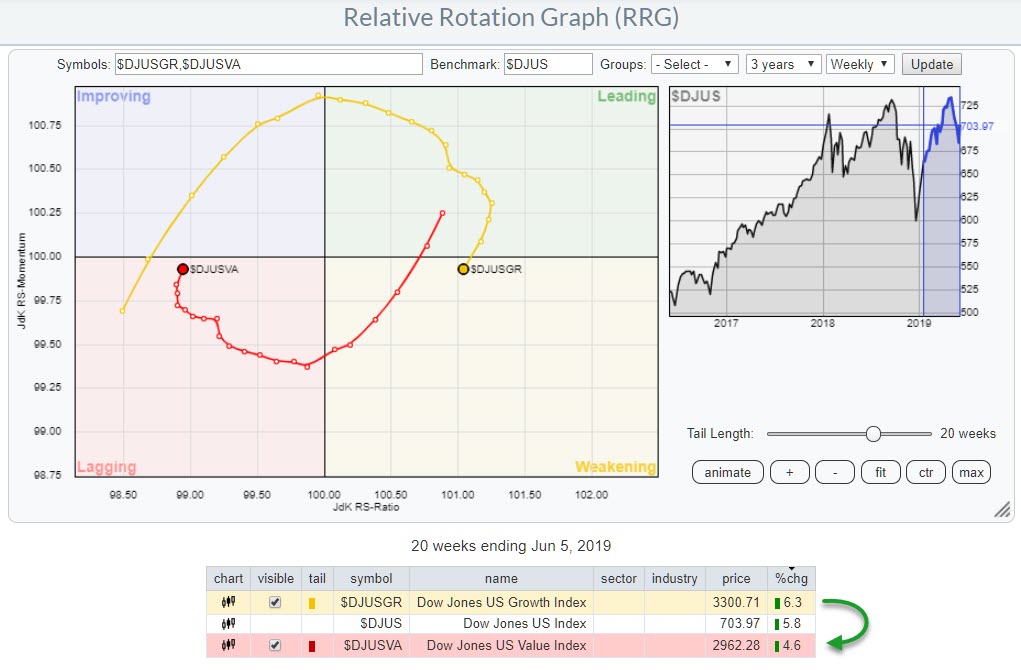
The RRG shows that the tails for Growth and Value have just turned into opposite directions. Growth has rolled over while inside the leading quadrant and has started to lose on the RS-ratio scale as well. Value, which is still inside lagging but is close to entering the improving quadrant, has just turned into an RRG-Heading between 0-90 degrees (around 10° at the moment).
Because these two market segments have the tendency to rotate in opposite directions, these turns usually happen at more or less the same point in time.
The tail in the chart above goes back 20 weeks because that was the moment when the reverse rotation happened. In that 20-week period, Growth has outperformed Value by 1.7% and S&P 500 by 0.5%.
Looking Back
In the RRG below, the tails are positioned at the turning point during the week of 18 January.
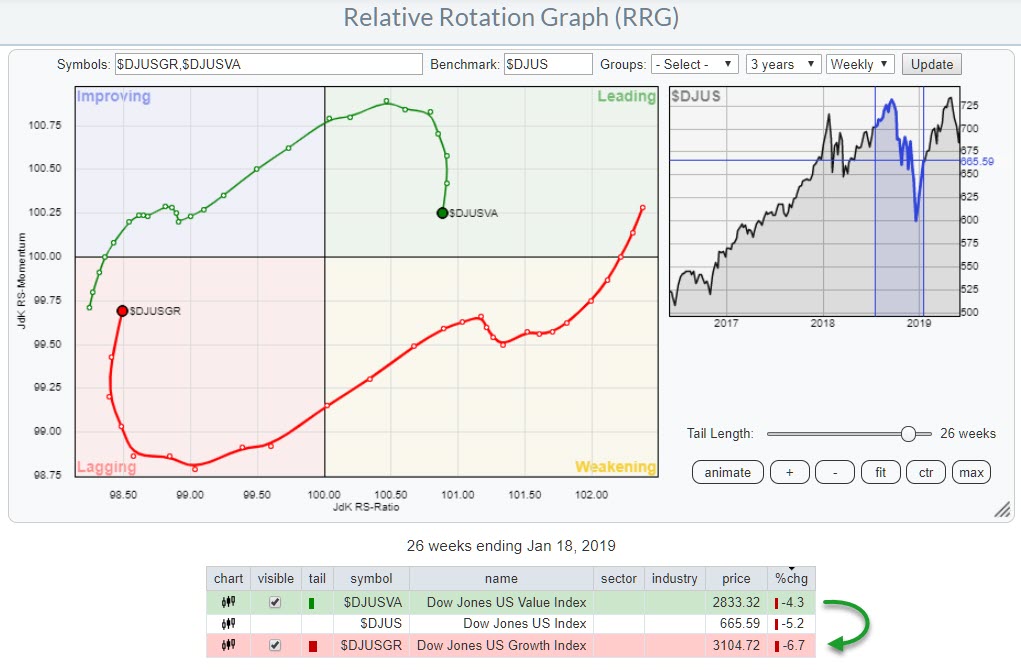
From there, we have to go backward 26 weeks to find the previous rotation from Growth to Value, which occurred 27 July 2018. This rotation (7-27-18 to 1-18-19) is shown by the tails in the RRG above, with Value outperforming Growth by 2.4% and the S&P by 0.9%.
Growth / Value vs. The Market
During the July-18 to Jan-19 outperformance of Value over Growth, the market dropped 5%. From Jan-19 up through now, the has market rallied almost 6%.
Scrolling back through time, we can see this rotational behavior confirming the general tendency for Value to perform well during times of market weakness (defensive) and Growth to pick up when the market does well (offensive).
Clearly, these observations are not ironclad or engraved in stone, but they will give you some additional information for you to use in your game plan for attacking the markets.
My regular blog is the RRG Charts blog. If you would like to receive a notification when a new article is published there, simply "Subscribe" with your email address.
Julius de Kempenaer
Senior Technical Analyst, StockCharts.com
Creator, Relative Rotation Graphs
Founder, RRG Research
Want to stay up to date with the latest market insights from Julius?
– Follow @RRGResearch on Twitter
– Like RRG Research on Facebook
– Follow RRG Research on LinkedIn
– Subscribe to the RRG Charts blog on StockCharts
Feedback, comments or questions are welcome at Juliusdk@stockcharts.com. I cannot promise to respond to each and every message, but I will certainly read them and, where reasonably possible, use the feedback and comments or answer questions.
To discuss RRG with me on S.C.A.N., tag me using the handle Julius_RRG.
RRG, Relative Rotation Graphs, JdK RS-Ratio, and JdK RS-Momentum are registered trademarks of RRG Research.