 On the Relative Rotation Graph, the Real-estate sector is one of the better performing sectors vis-a-vis the S&P 500 index.
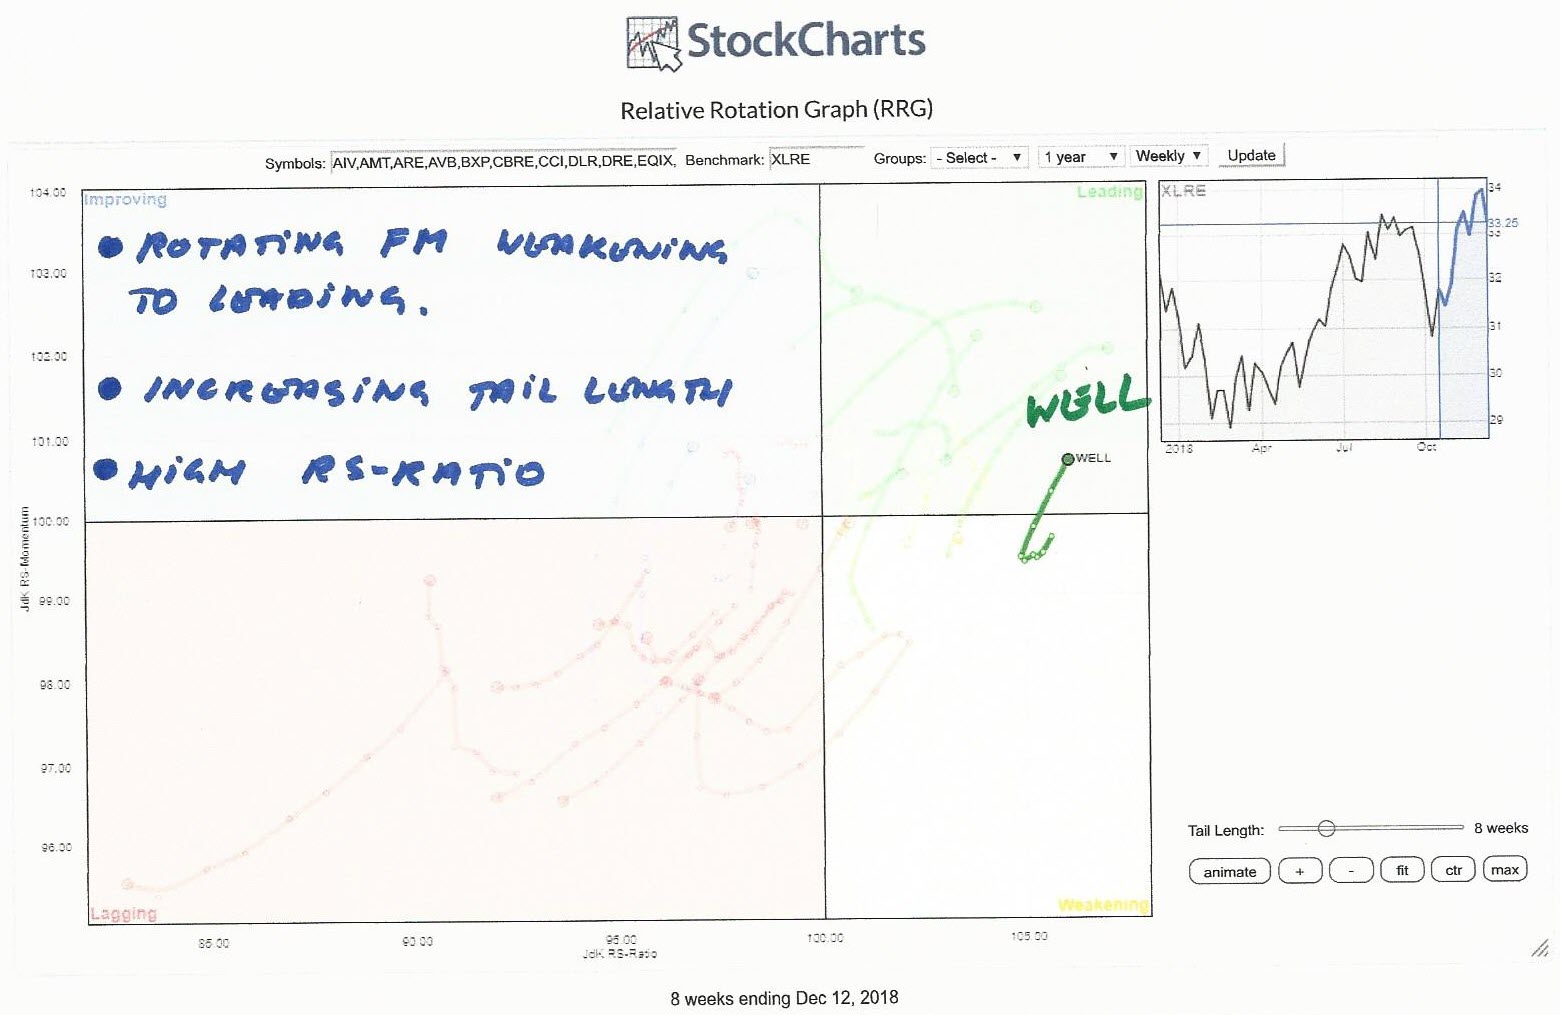
The RRG above shows the rotation of all the stocks in XLRE against XLRE. This gives us a picture of the relative positions for all these stocks against XLRE and against each other.
A few names stand out in a positive way. EXR, VTR, HCP, and WELL are all traveling higher on both axes and in a relative uptrend against XLRE.
One stock, in particular, is sending very bullish signals.
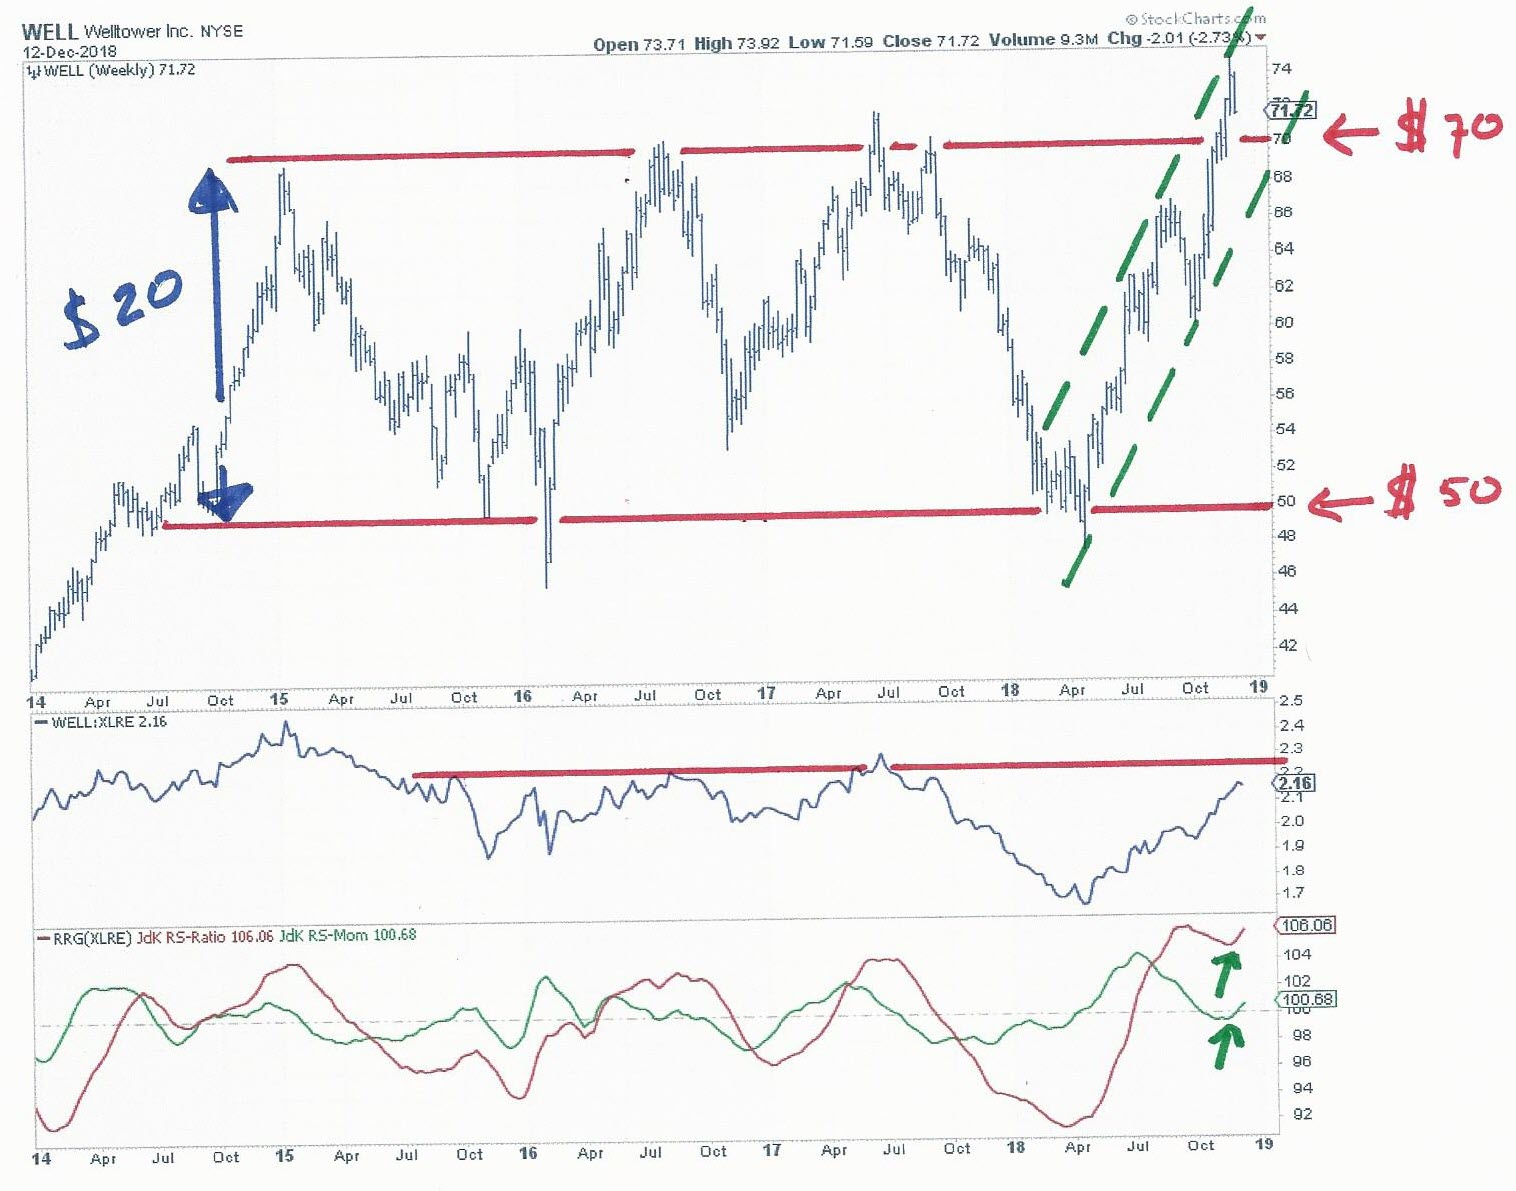 The chart of Welltower (WELL) is characterized by a very broad trading range since late 2014. Only a few weeks ago the stock managed to break above the upper boundary of that range, under very difficult general market conditions, sending a signal of strength.
IMHO the real resistance level was around $ 70. That level should now act as support in case of any corrections within the boundaries of the new rising channel.
If we use the classical way to measure price targets, after a break out of a range, by taking the height of the range ($ 20) and projecting that on top of the breakout level we come up with $ 90.
Given the limited downside risk, as long as support at $ 70 holds, this gives a very good risk/reward level.
From a relative perspective WELL is doing very well ;)
The raw RS-Line is nearing overhead resistance but at this pace, I would not be surprised if that will be taken out just like resistance on the price chart was taken out.
The RRG-Lines are showing a strong setup with the RS-Ratio well above 100 and the RS-Momentum line turning back above 100 again. This is causing WELL to rotate back to leading after a short rotation through weakening.
This type of rotation is usually followed by more outperformance versus the benchmark.
My regular blog is the RRG blog If you would like to receive a notification when a new article is published there, simply "Subscribe" with your email address using the form below.
Julius de Kempenaer | RRG Research
RRG, Relative Rotation Graphs, JdK RS-Ratio, and JdK RS-Momentum are registered TradeMarks ®; of RRG Research
Follow RRG Research on social media:
Feedback, comments or questions are welcome at Juliusdk@stockcharts.com. I cannot promise to respond to each and every message but I will certainly read them and where reasonably possible use the feedback and comments or answer questions.
If you want to discuss RRG with me on SCAN, please use my handle Julius_RRG so that I will get a notification.