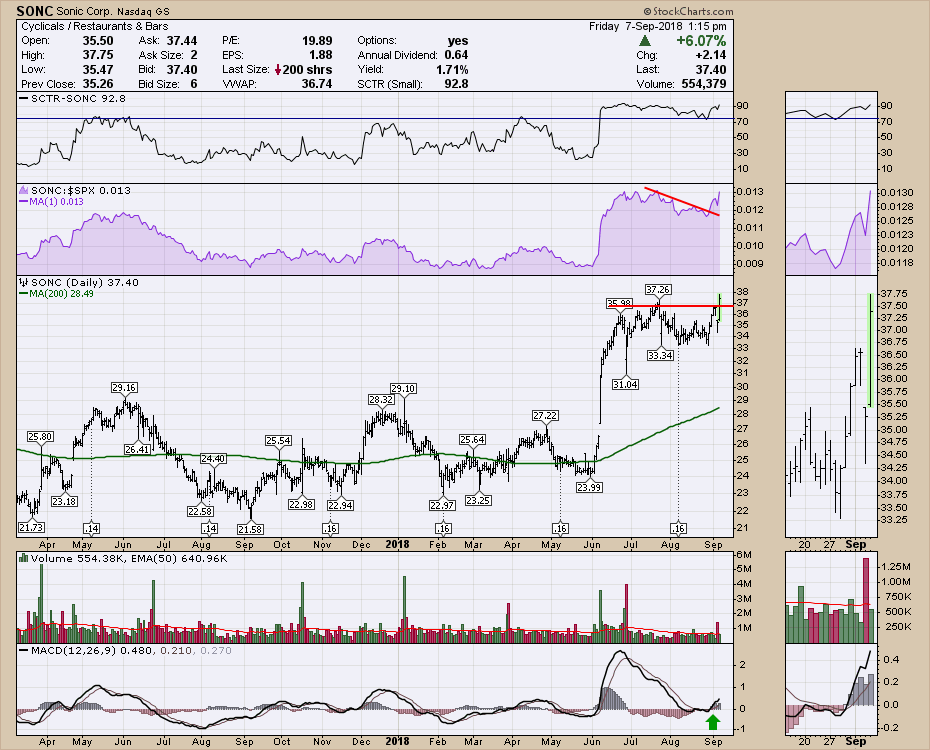
Sonic recently (June) broke above a big sideways basing pattern. It looks like Sonic is now ready to break above a consolidation after the sudden surge.
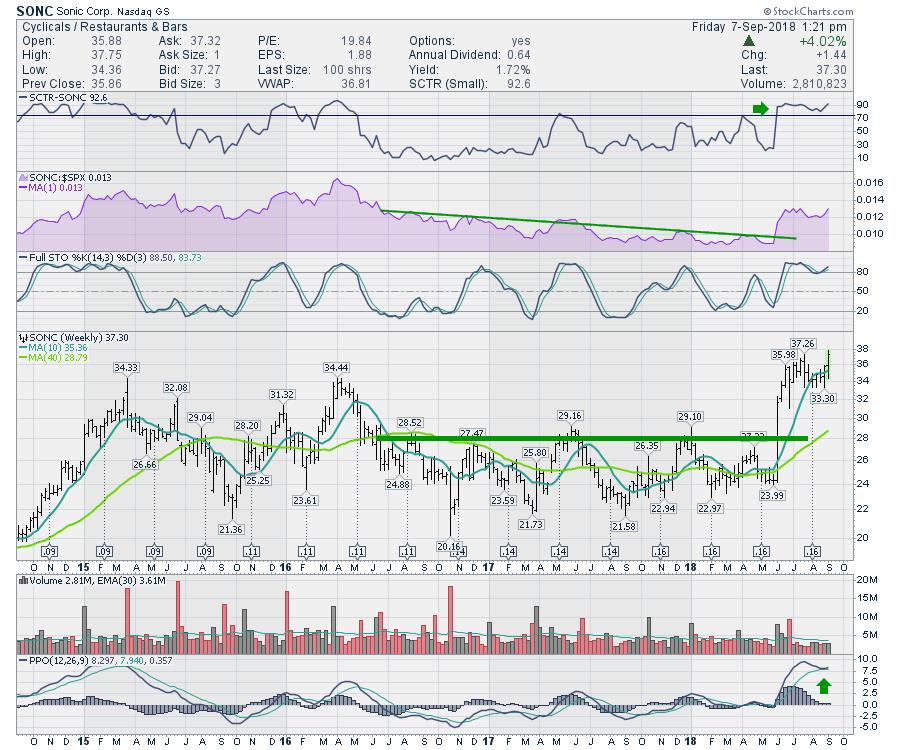
The weekly chart also gives us a reason for optimism. The weekly is a clear breakout from years of channel trading.
Attached are some recent videos I have posted. The Final Bar covers the breakdown on European indexes this week.
Here is the Commodities countdown video for the week. Bonds have an interesting setup this week. A failed breakout on TLT suggests paying attention.
The Canadian Technician. While I was becoming more bullish when I recorded this on Monday August 26th, the Canadian market has since given back its breakout and is trading at fresh three month lows now...I would have to interject a note of caution on the failed breakout created. A false breakout is usually followed by a larger move in the other direction. The real problem is the Canadian market is back to prices we saw in June while the US markets are significantly higher.
If you are missing intermarket signals in the market, follow me on Twitter and check out my Vimeo Channel often. Bookmark it for easy access!
Good trading,
Greg Schnell, CMT, MFTA
Senior Technical Analyst, StockCharts.com
Author, Stock Charts for Dummies
Want to read more from Greg? Be sure to follow his two StockCharts blogs:
Commodities Countdown and The Canadian Technician