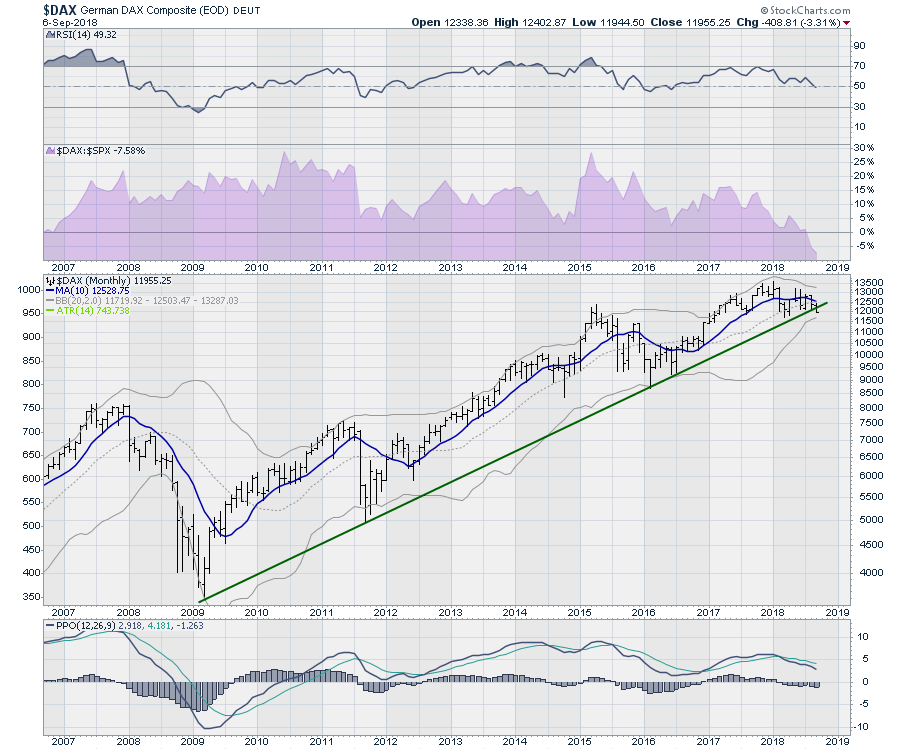
While all of the European markets had a tough week, the chart of Germany is snapping a couple of very major trend lines on a weekly and monthly basis. How September ends will be important for the monthly charts as two major things are currently setting up that we have not seen in a while.
First of all on the monthly chart, this is the first breach on the 2009-2018 trend line. Obviously it is early in the month, but we shouldn't ignore a 9-year trend line as it is breaking. The 10 month moving average is in blue and it is broken as well. The third thing of note is we are below the gray dotted line which is the center of the Bollinger Bands. Each signal on its own is not good, but this week we are adding the third of three signals. Perhaps it rallies into month end. It is worth noting what a fine knife edge we are on in Europes largest and strongest economy.
When we move into the weekly chart below, the trend line is broken as well obviously. But we have additional clues that this can be the start of something much larger. I have shown the break of the 30 month trend line off the 2016 low. We also have the relative strength (purple shaded area) of Germany compared to the $SPX breaking to new lows on the chart. That is not good for capital flow toward that market. When markets like Germany start to underperform even more, that increases capital flows away from those markets.
Secondly, we are breaking below the horizontal support level from the 2015 high. There is the last gasp of support at 11750. Watch to see if that holds.
Our notes from early May worked out in giving us advance notice. We had a clue since the second quarter that we might be seeing the final high with the PPO breaking below zero as a warning before the final rally. The PPO is now going back below zero this week. A negative PPO is a good reason to avoid a market at least until the PPO starts to turn higher.
On the price panel, the $DAX has failed at a test of the January high and the price is making lower highs and lower lows since May. That's the definition of a downtrend.
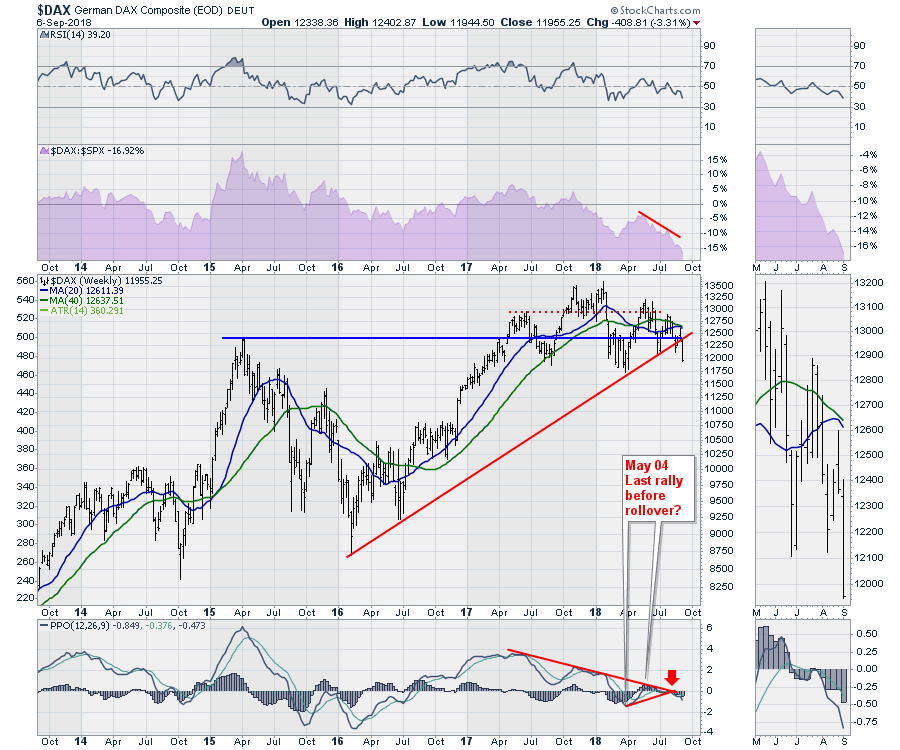 While the $DAX may find support at the 11750 level, this chart is broken for now. Friday needs an extreme rally not to close below the uptrend line. Caution should be used until the chart firms up. US investors can also look at the EWG chart for trading based on the German market.
Good trading,
Greg Schnell, CMT, MFTA.